

HOW’S THE MARKET? April 2022 UPDATE

The market remained heated, if not overheated, in Q1, as our review of home-price appreciation, and supply and demand indicators will illustrate.
As of March 31st, mortgage interest rates have skyrocketed 50% in 2022, with a particularly large jump in March. The number of cash buyers continue to make it very challenging for buyers financing a purchase. For a number of reasons the lower risk of a cash offer is a tough one to overcome with a financed purchase.
For buyers financing their purchase, interest rates play an enormous role in monthly housing costs. Depending on the speed and scale of changes, declining interest rates can help supercharge demand, as they did in 2021, while rapidly increasing rates typically cool the market, as occurred in the 2nd half of 2018. If both interest rates and home prices soar, there is a double whammy on housing affordability.
It is very difficult to predict interest rate changes: 3 months ago, Freddie Mac predicted an average, 30-year, fixed rate of 3.6% for 2022; at the end of March, it hit 4.67%.
“Low inventory” does not necessarily mean fewer homes are being put up for sale. Indeed, sales volumes hit multi-year highs in 2021, fed by an increase in new listings. But “inventory” is measured by what is for sale on a given day, and even if the quantity of new listings is steady or climbing, the number of active listings can drop if they are selling more quickly. Historically high market velocity has been pushing the supply of active listings down to historic lows.
This report contains analyses reviewing many of these issues through Q1 2022.
Q2 is typically the highest-demand, most active selling season of the year.
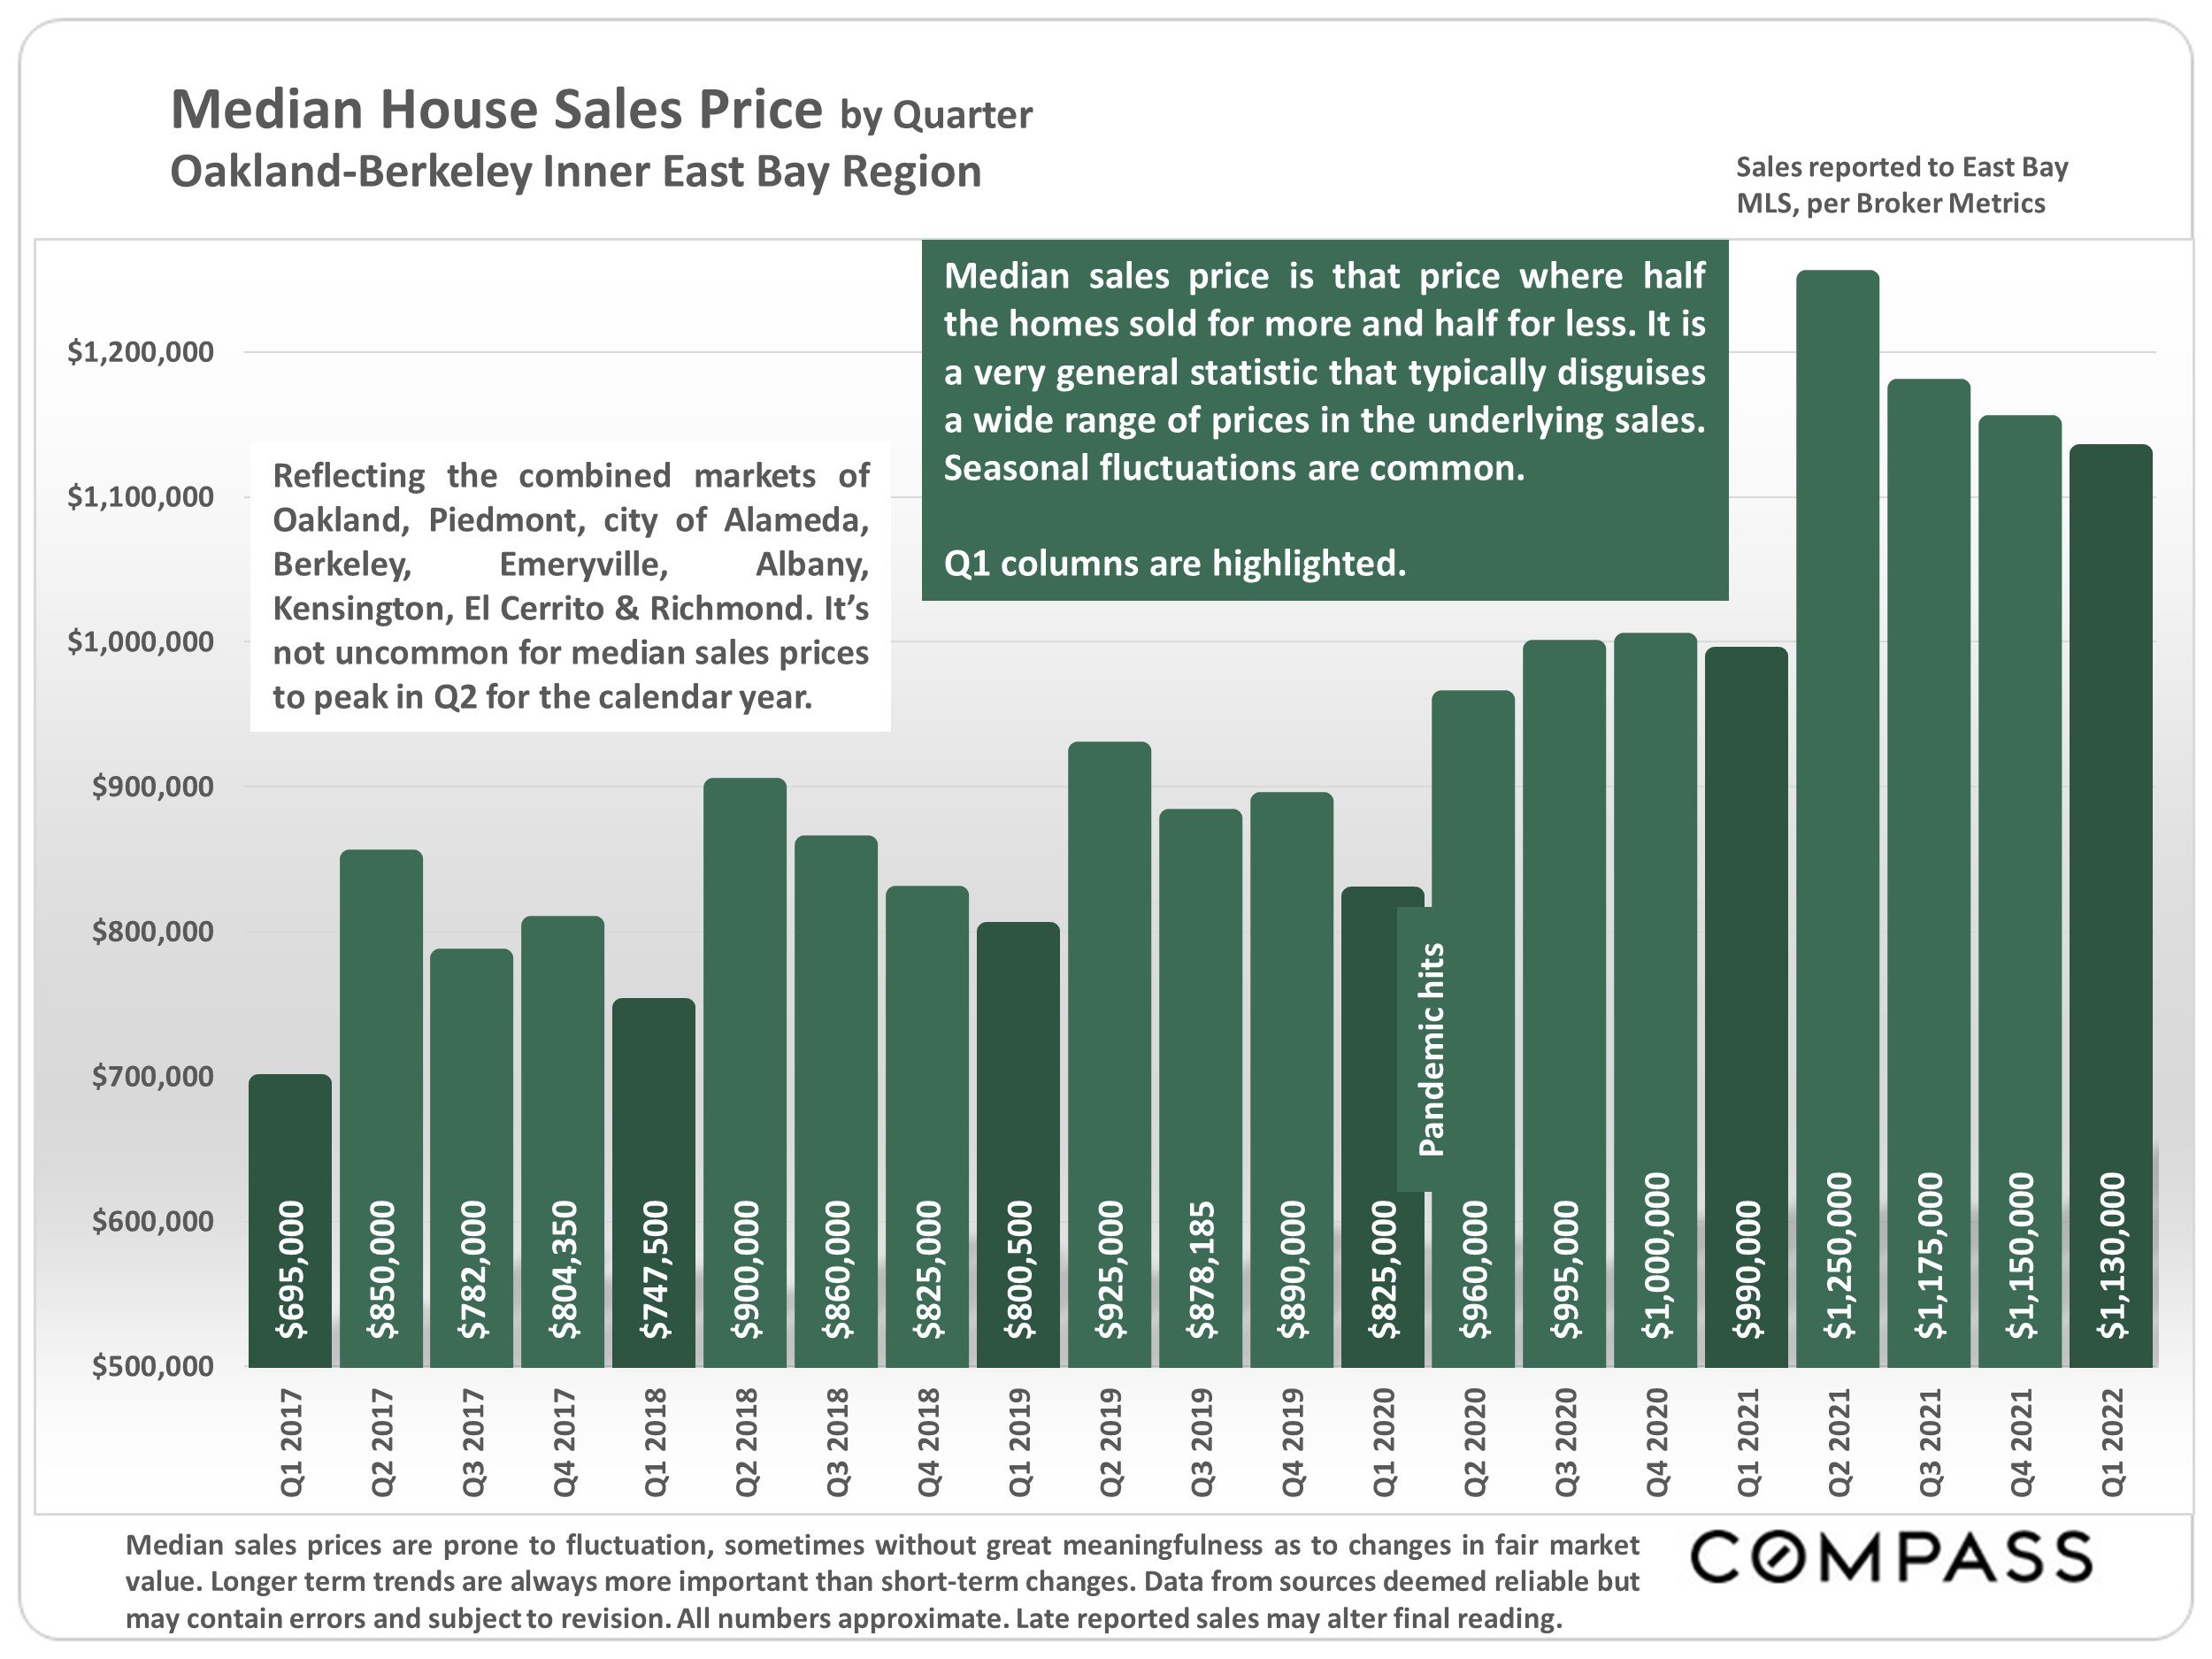
This chart reflect the median house sales price in the Inner East Bay Region broken down by quarter. The median price for Q1 2022 was $1,130,000. This is in comparison to $990,000 in Q1 2021, an increase of 14% YOY. Q1 columns are highlighted. Median sales price is that price where half the homes sold for more and half for less. It is a very general statistic that disguises a wide range of prices underlying sales. It’s not uncommon for median sales prices to peak in Q2 for the calendar year.
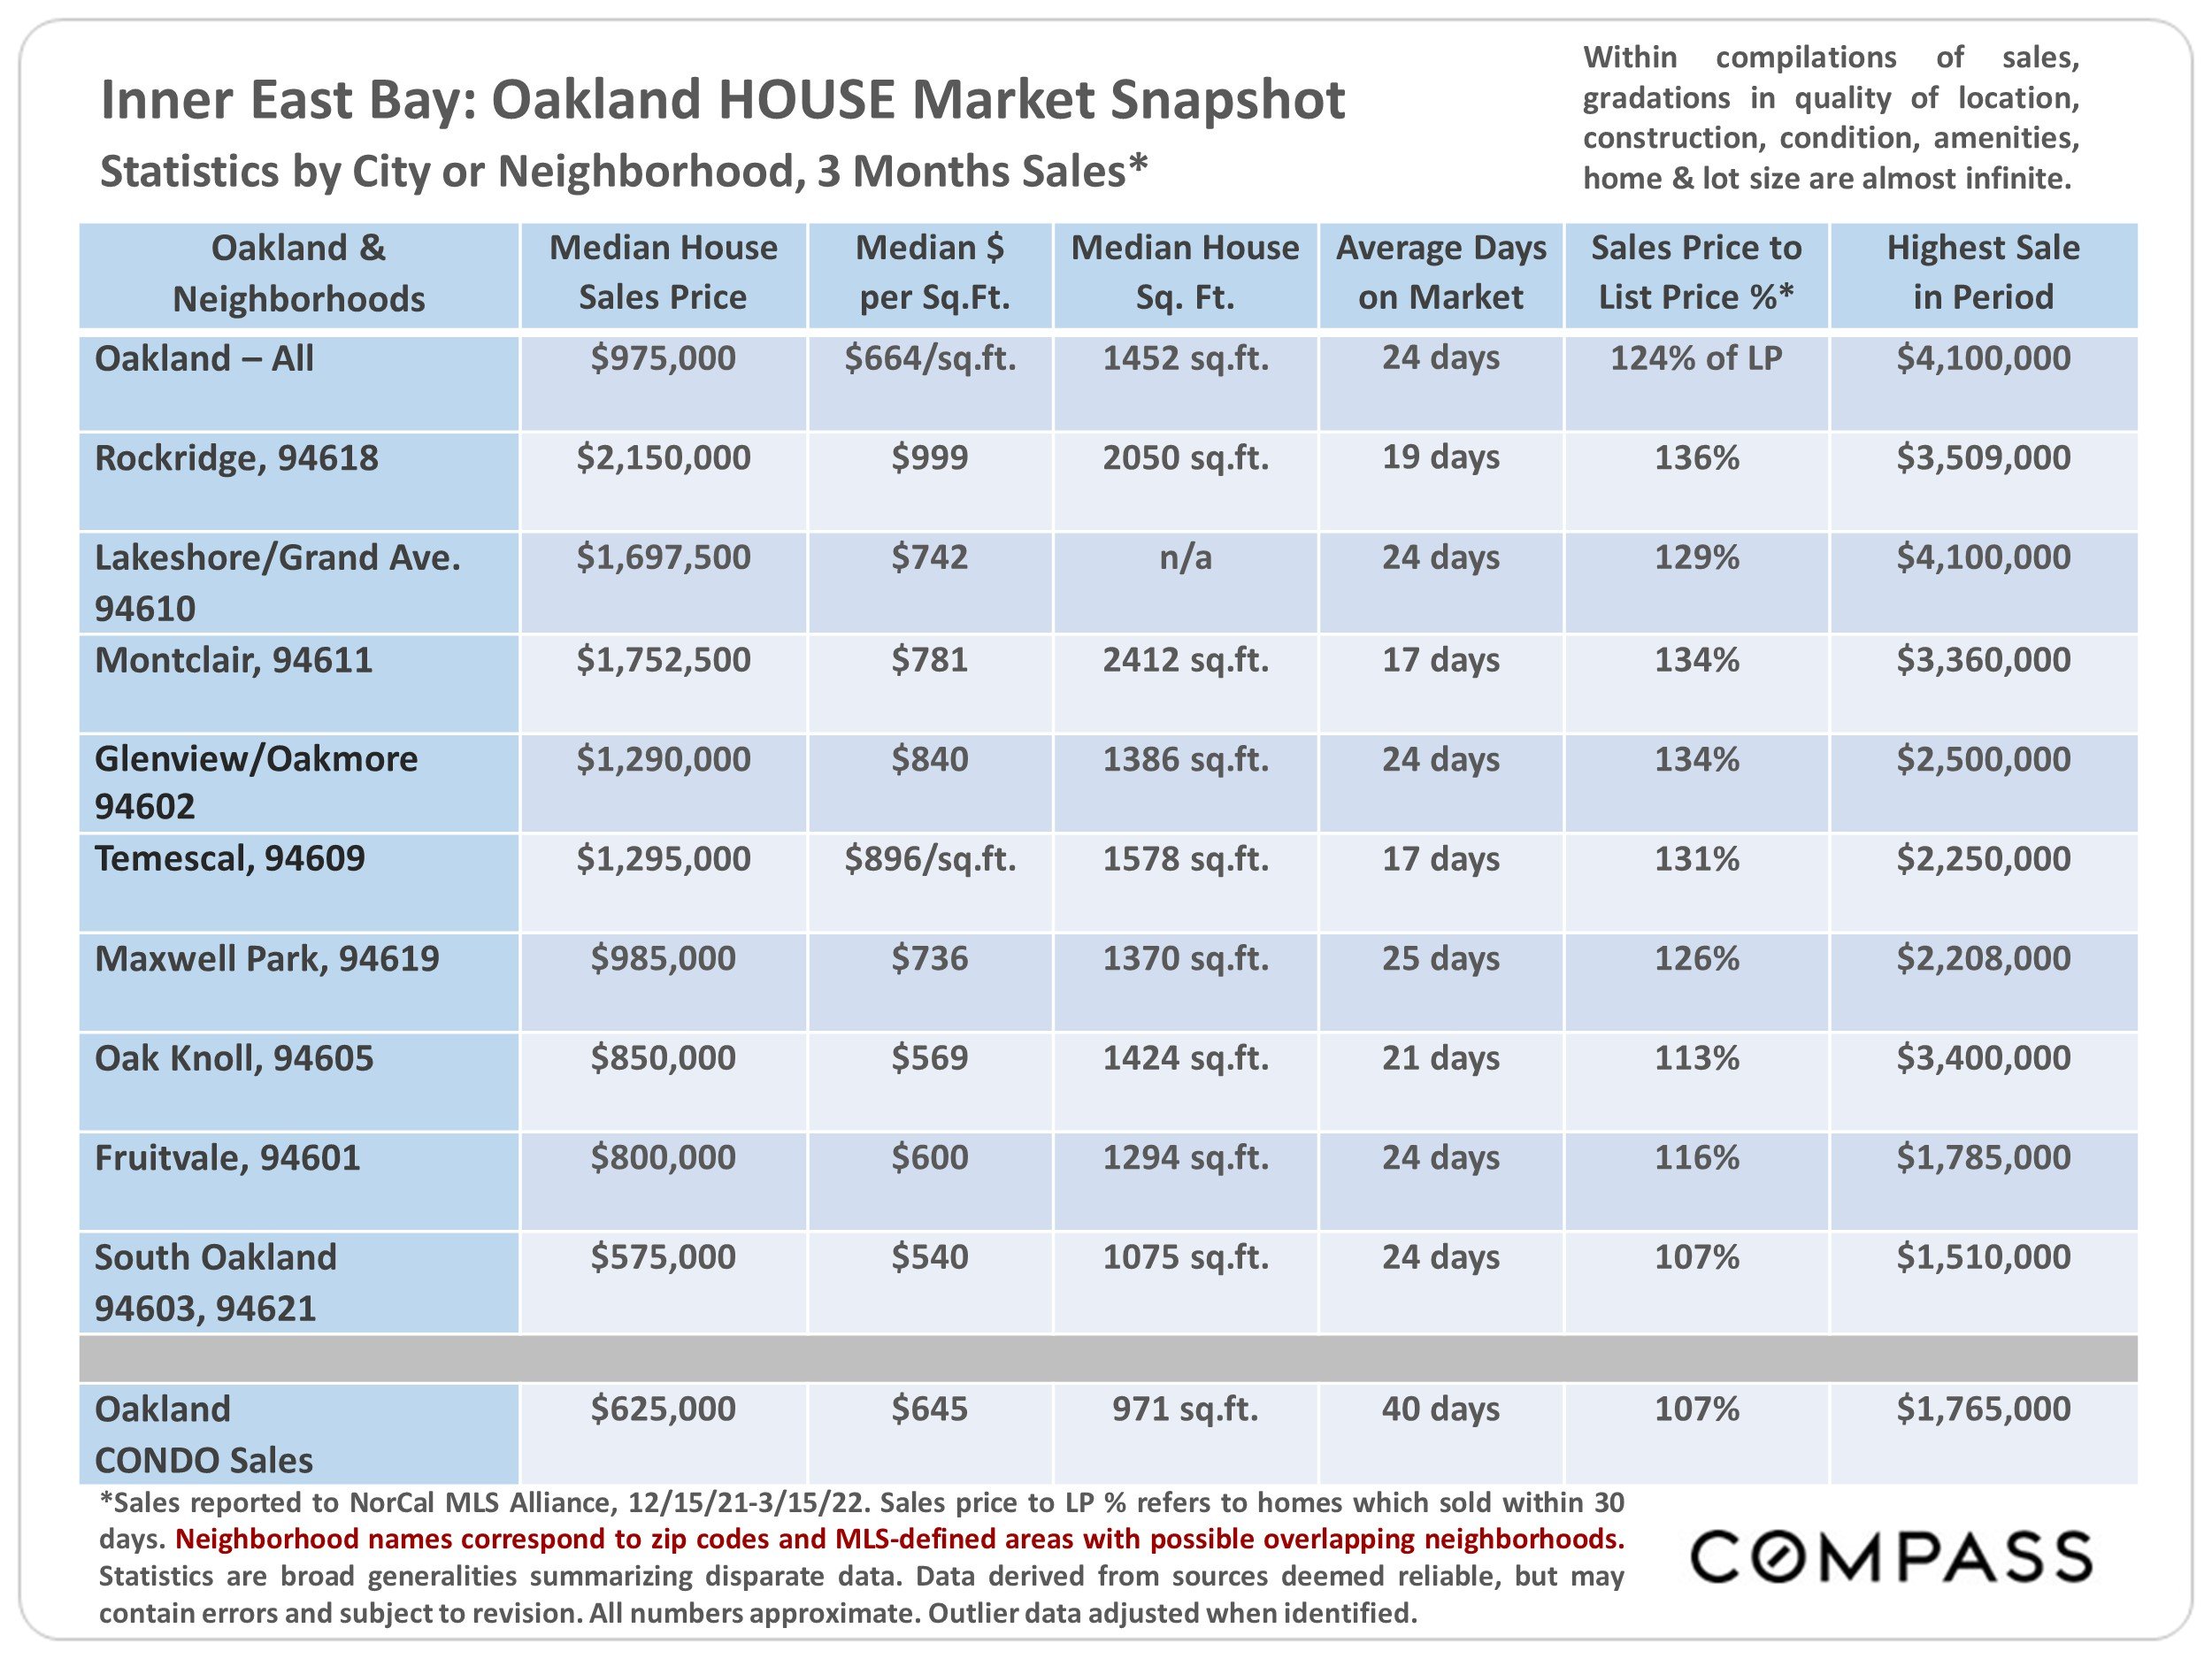
Here is a snapshot of the Oakland house market based on the last 3 months of sales. The Median sales price was $975,000. The median $ pf Sq.Ft. was $664. The average days on the market was 24 days. The average sales price to list price was 124% of list price. The highest sale during the period was $4,100,000.
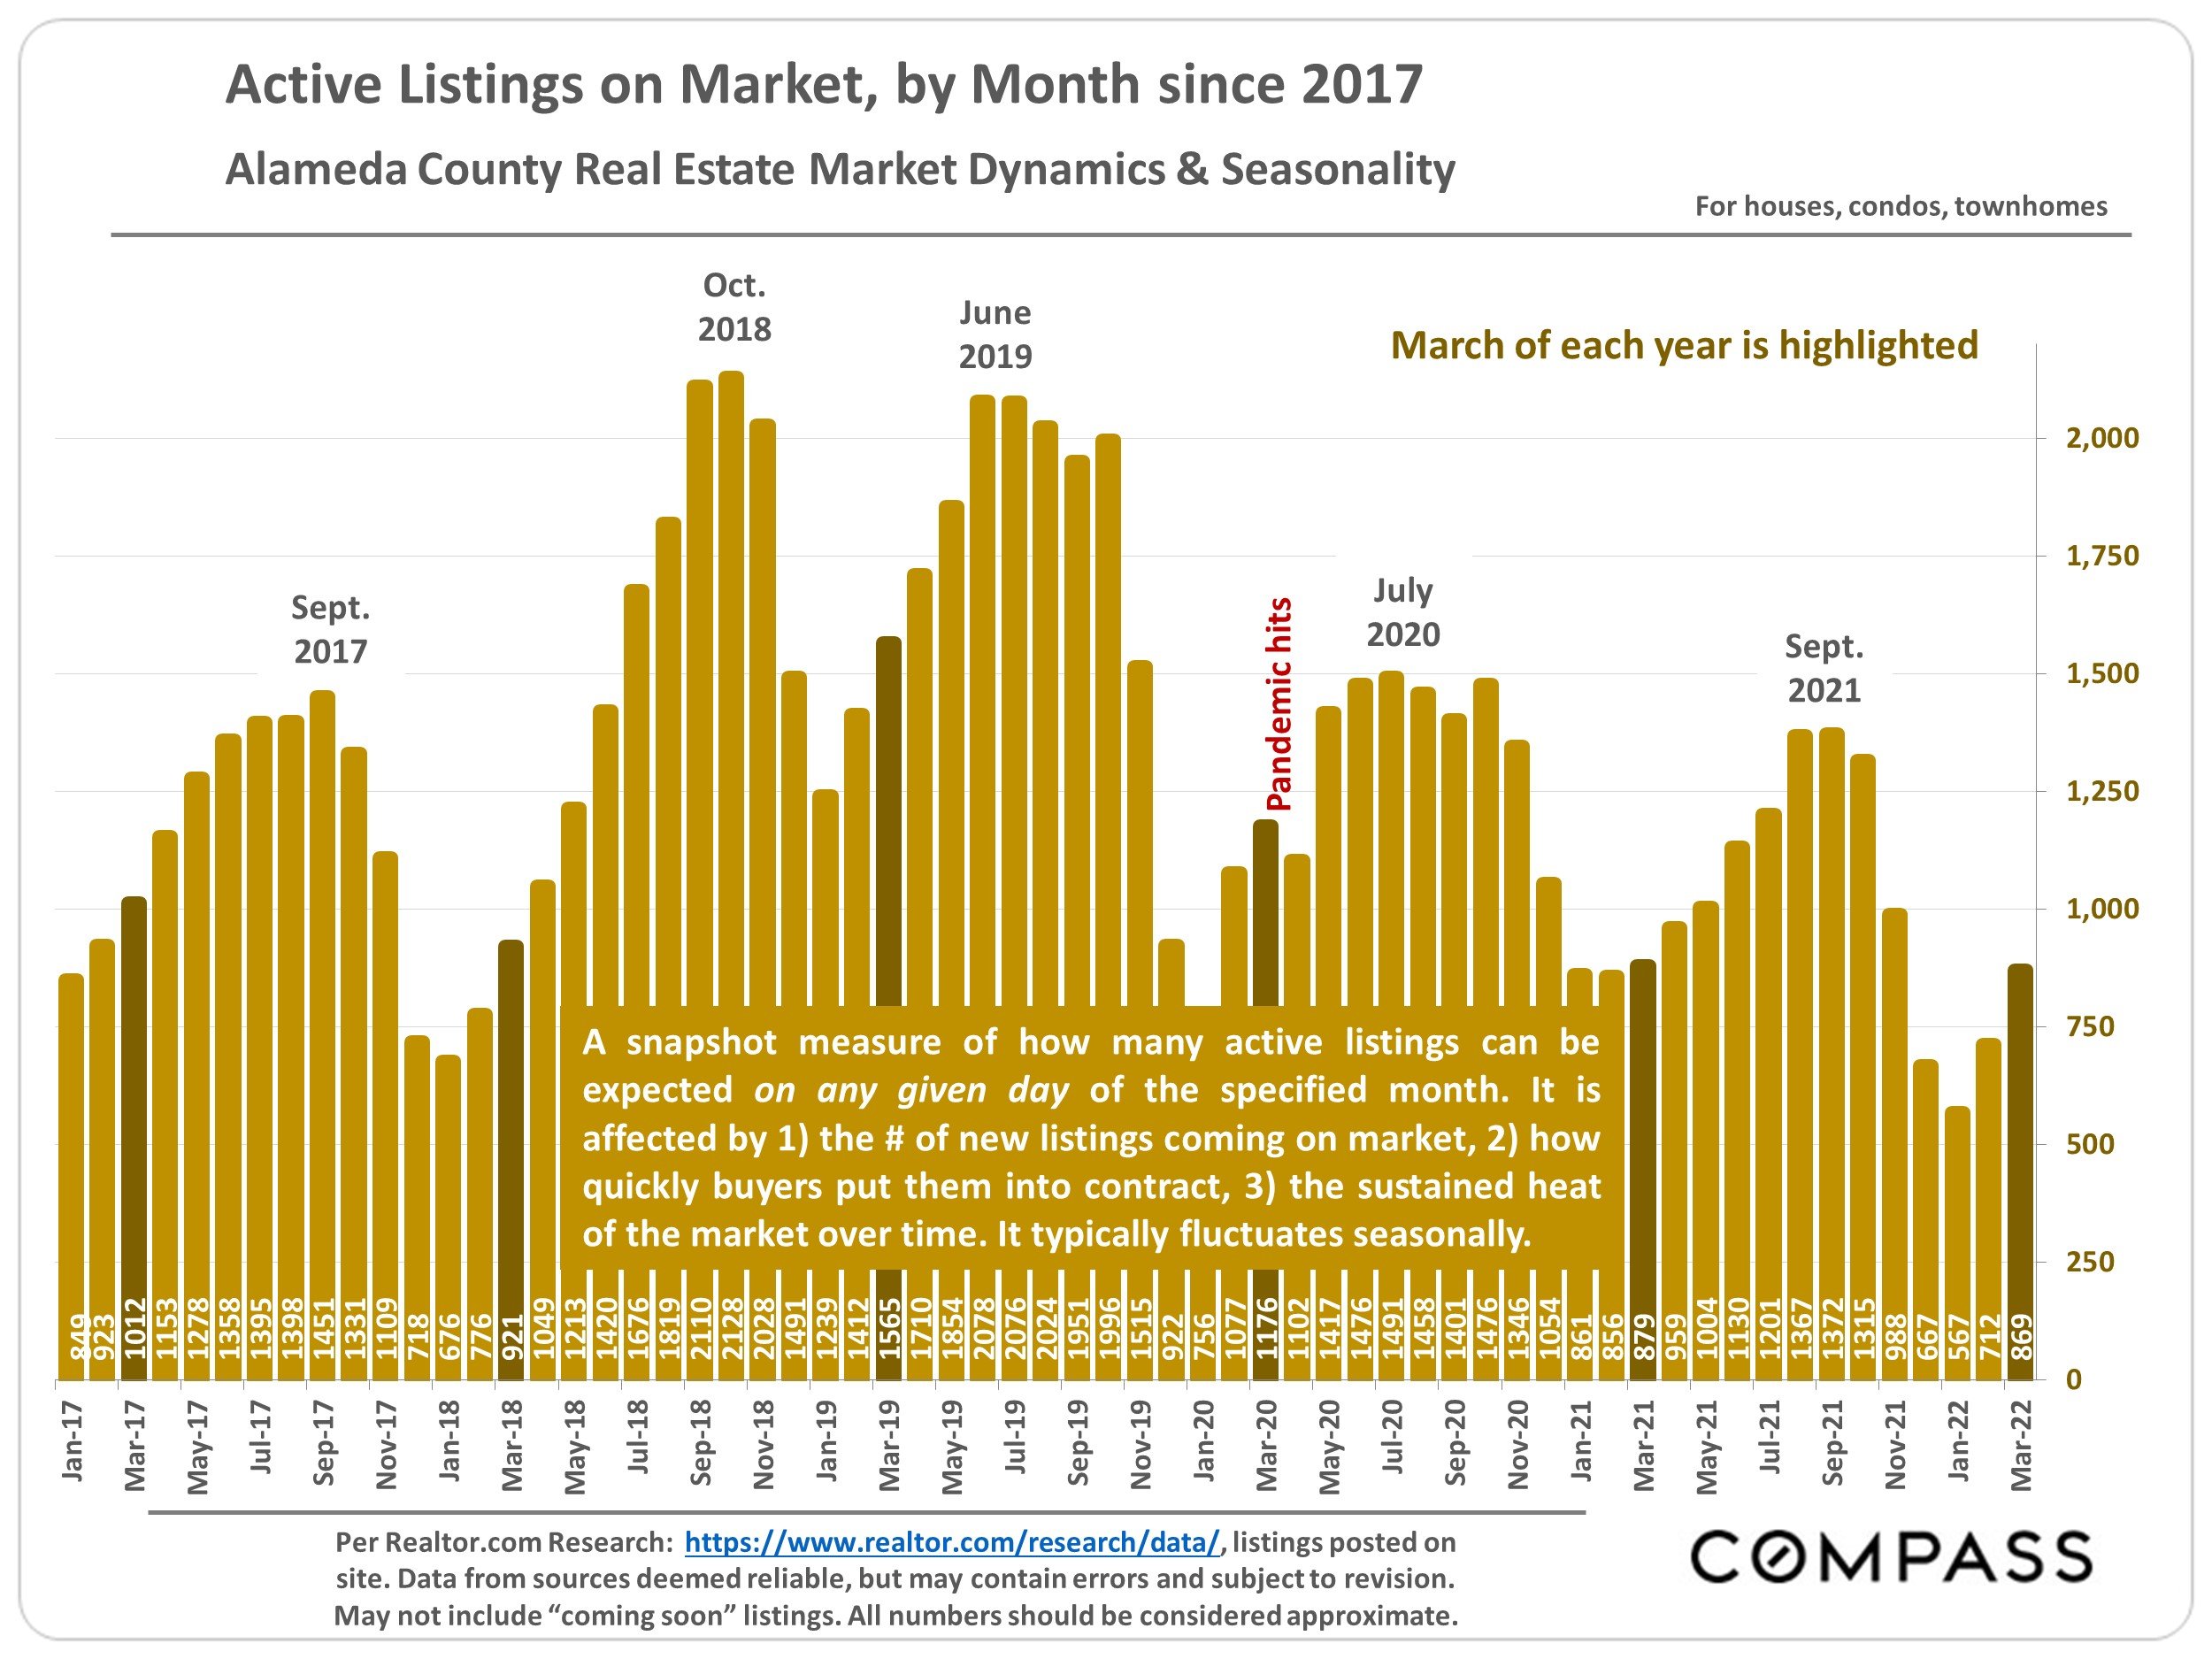
A snapshot measure of how many active listings can be expected on any given day of the specified month. It is affected by the number of new listings coming on market, how quickly buyers put them into contract, and the sustained heat of the market over time. March of each year is highlighted. Active listings normally fluctuate seasonally.
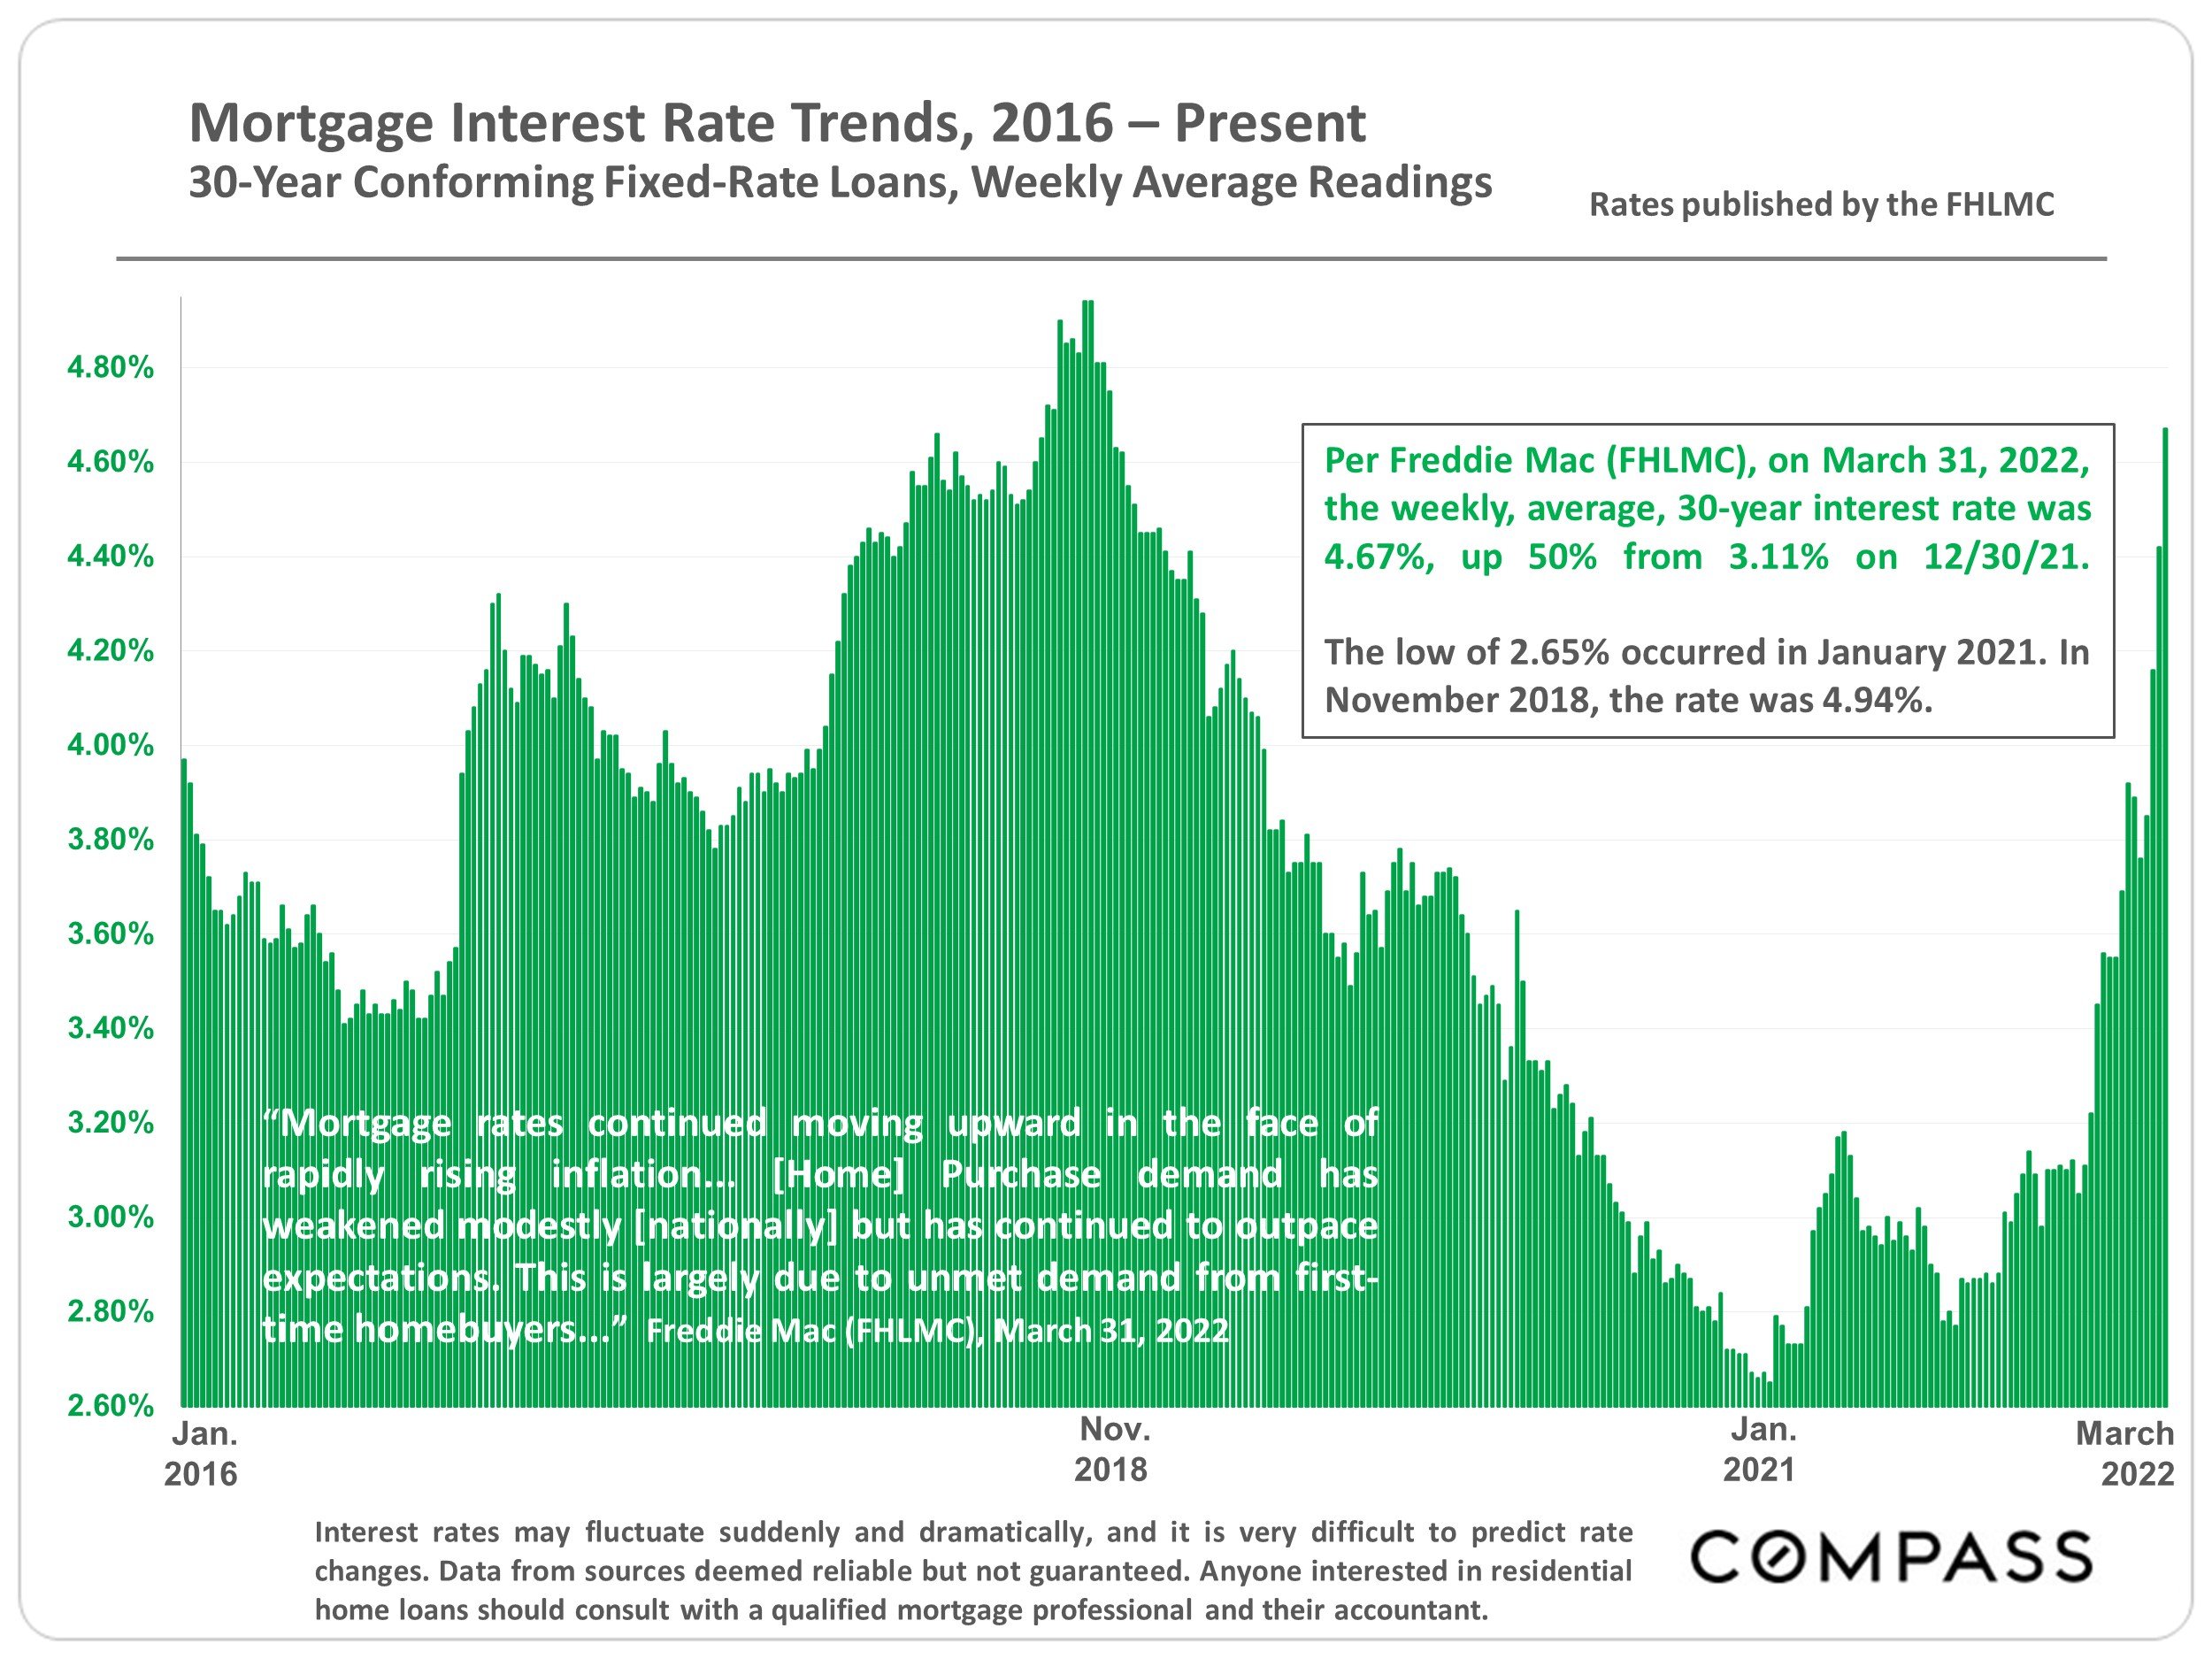
“Mortgage rates continued moving upward in the face of rapidly rising inflation… [Home] Purchase demand has weakened moestly [nationally] but has continued to outpace expectations. This is largely due to unmet demand from first-time homebuyers…” — Freddie Mac, March 21, 2022. Per Freddie Mac, the weekly average, 30-year interest rate was 4.67%, up 50% from 3.11% on 12/30/21. The low of 2.65% occurred in January 2021. In November 2018, the rate was 4.94%.
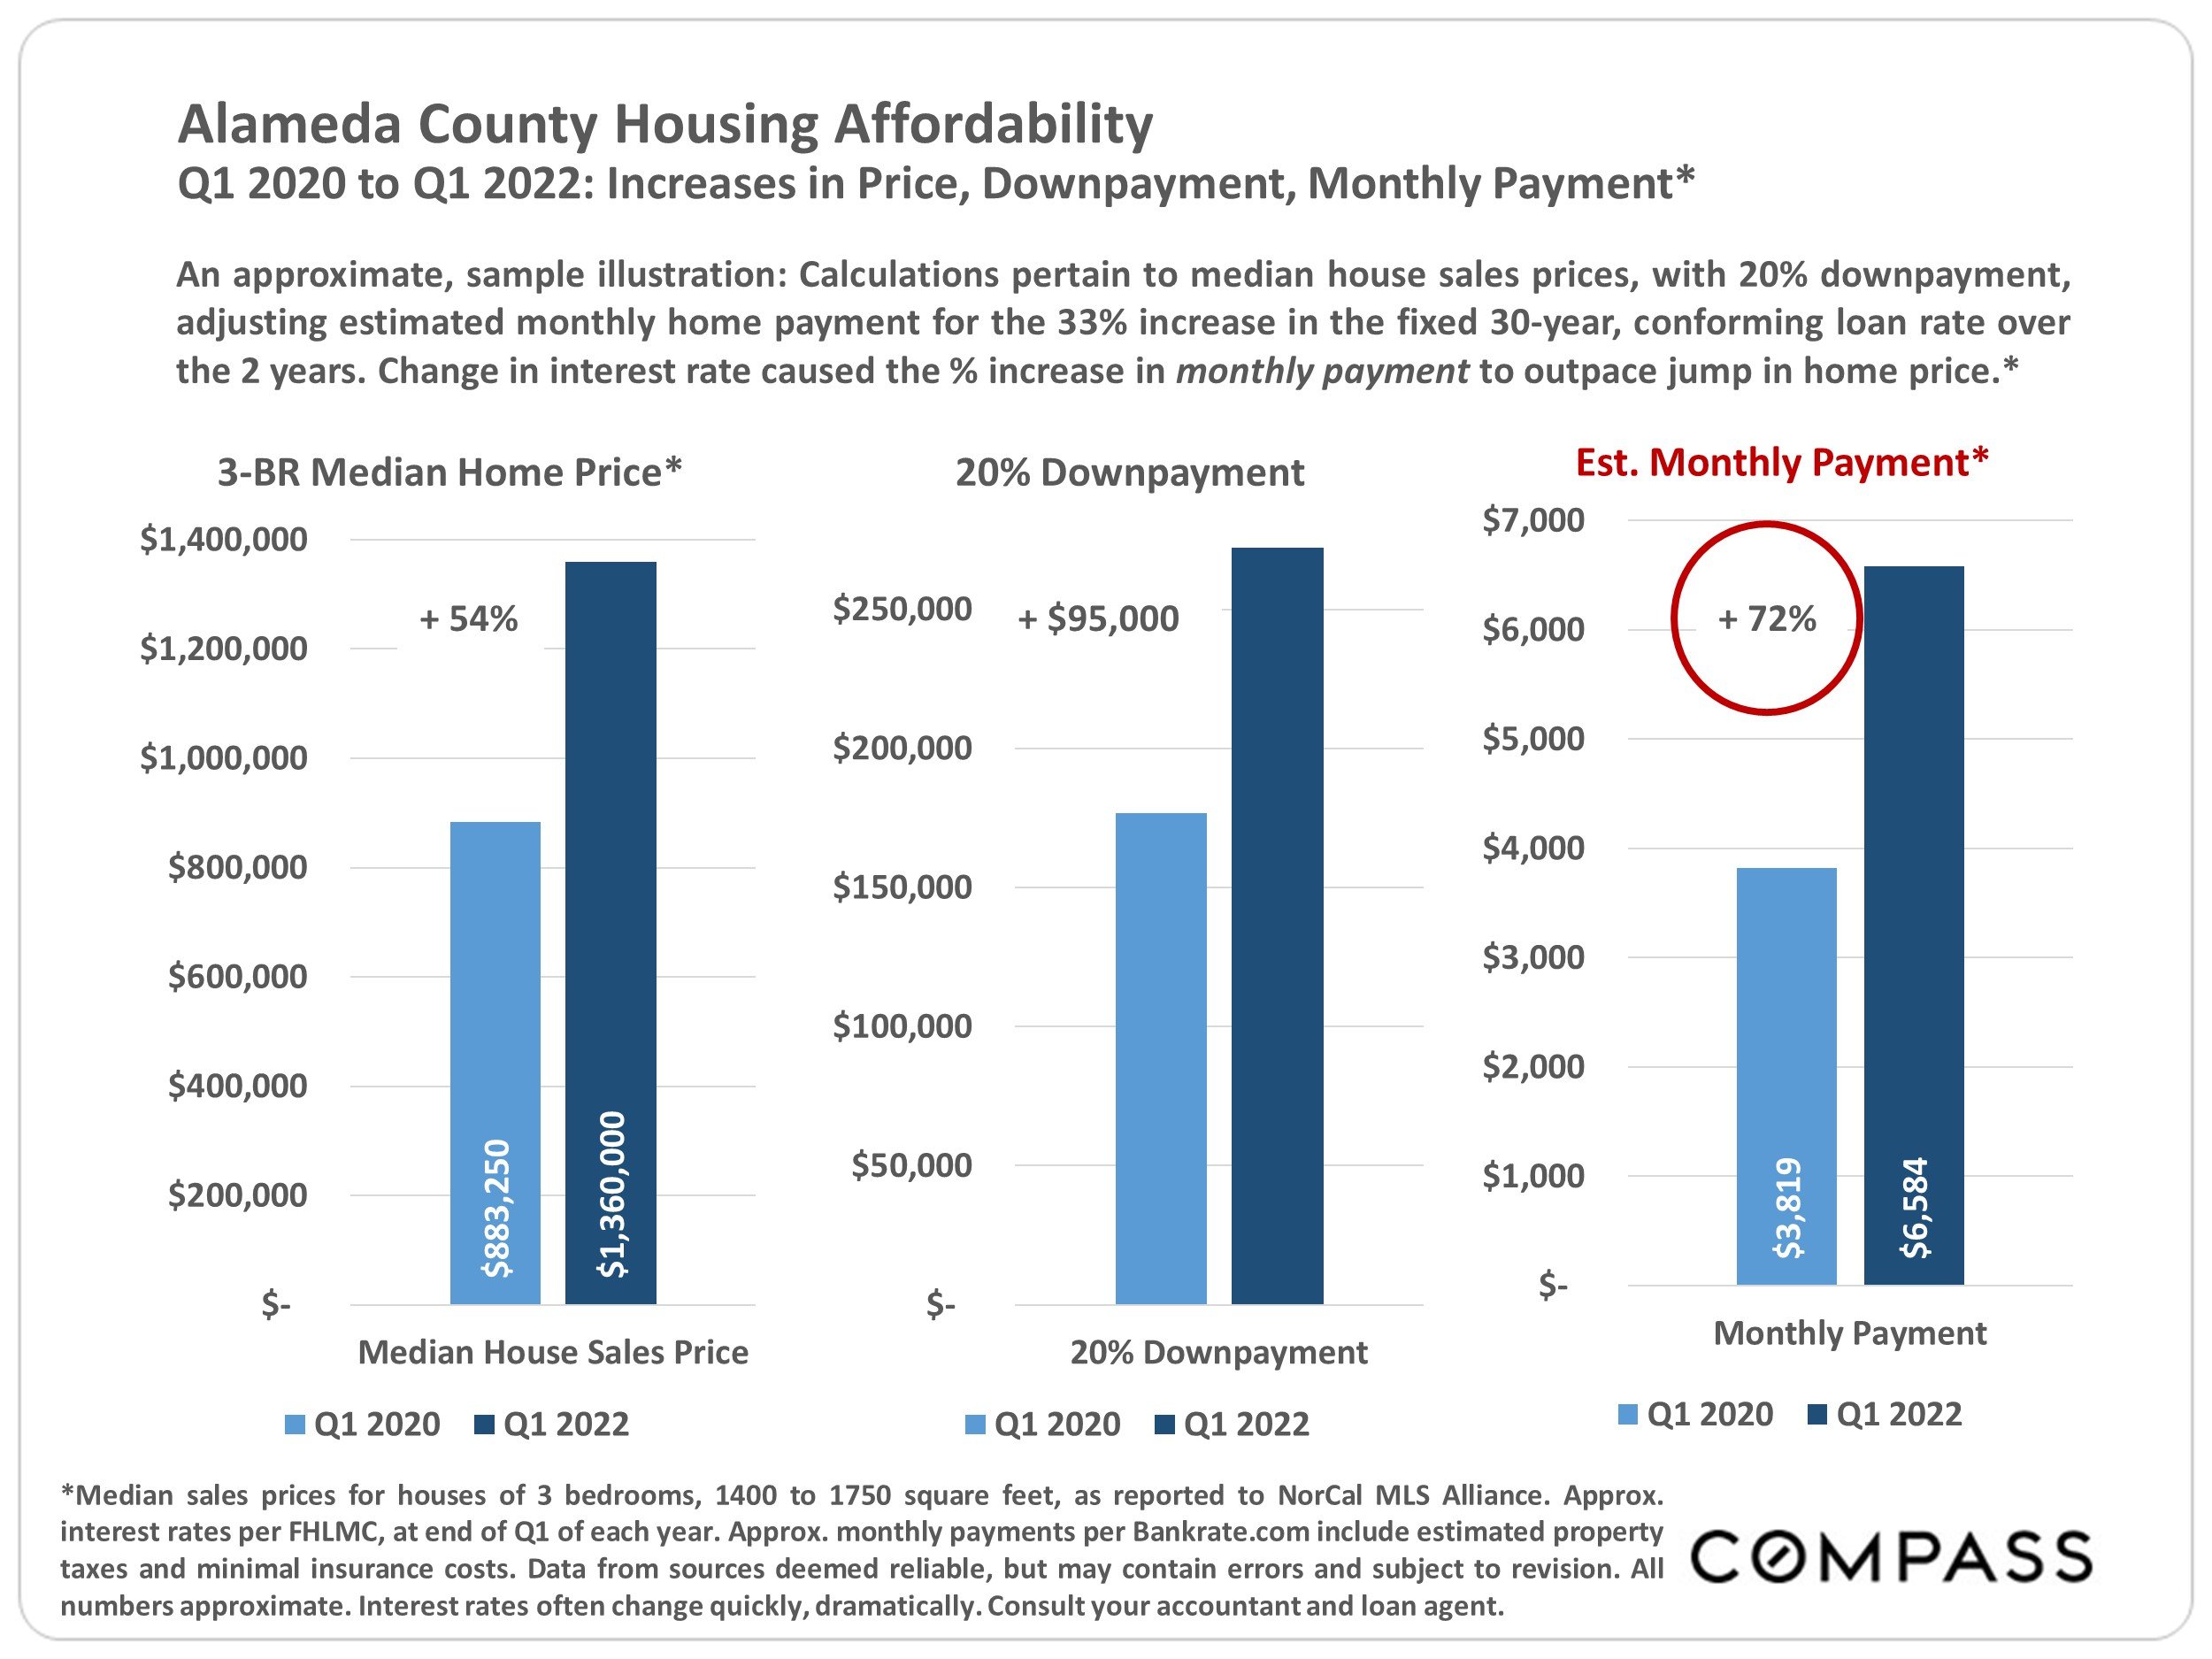
The median price for a 3 bedroom house jumped 54% in Alameda county between Q1 2020 and Q1 2022, from $883,250 to $1,360,000. The amount it would take for a 20% down payment increased by $95,000 in the same time range. The biggest jump was that in the estimated monthly payment, which increased by 72%, from $3,819 in Q1 2020 to $6,584 in Q1 2022. Change in interest rate caused the percent increase in monthly payment to outpace jump in home price.
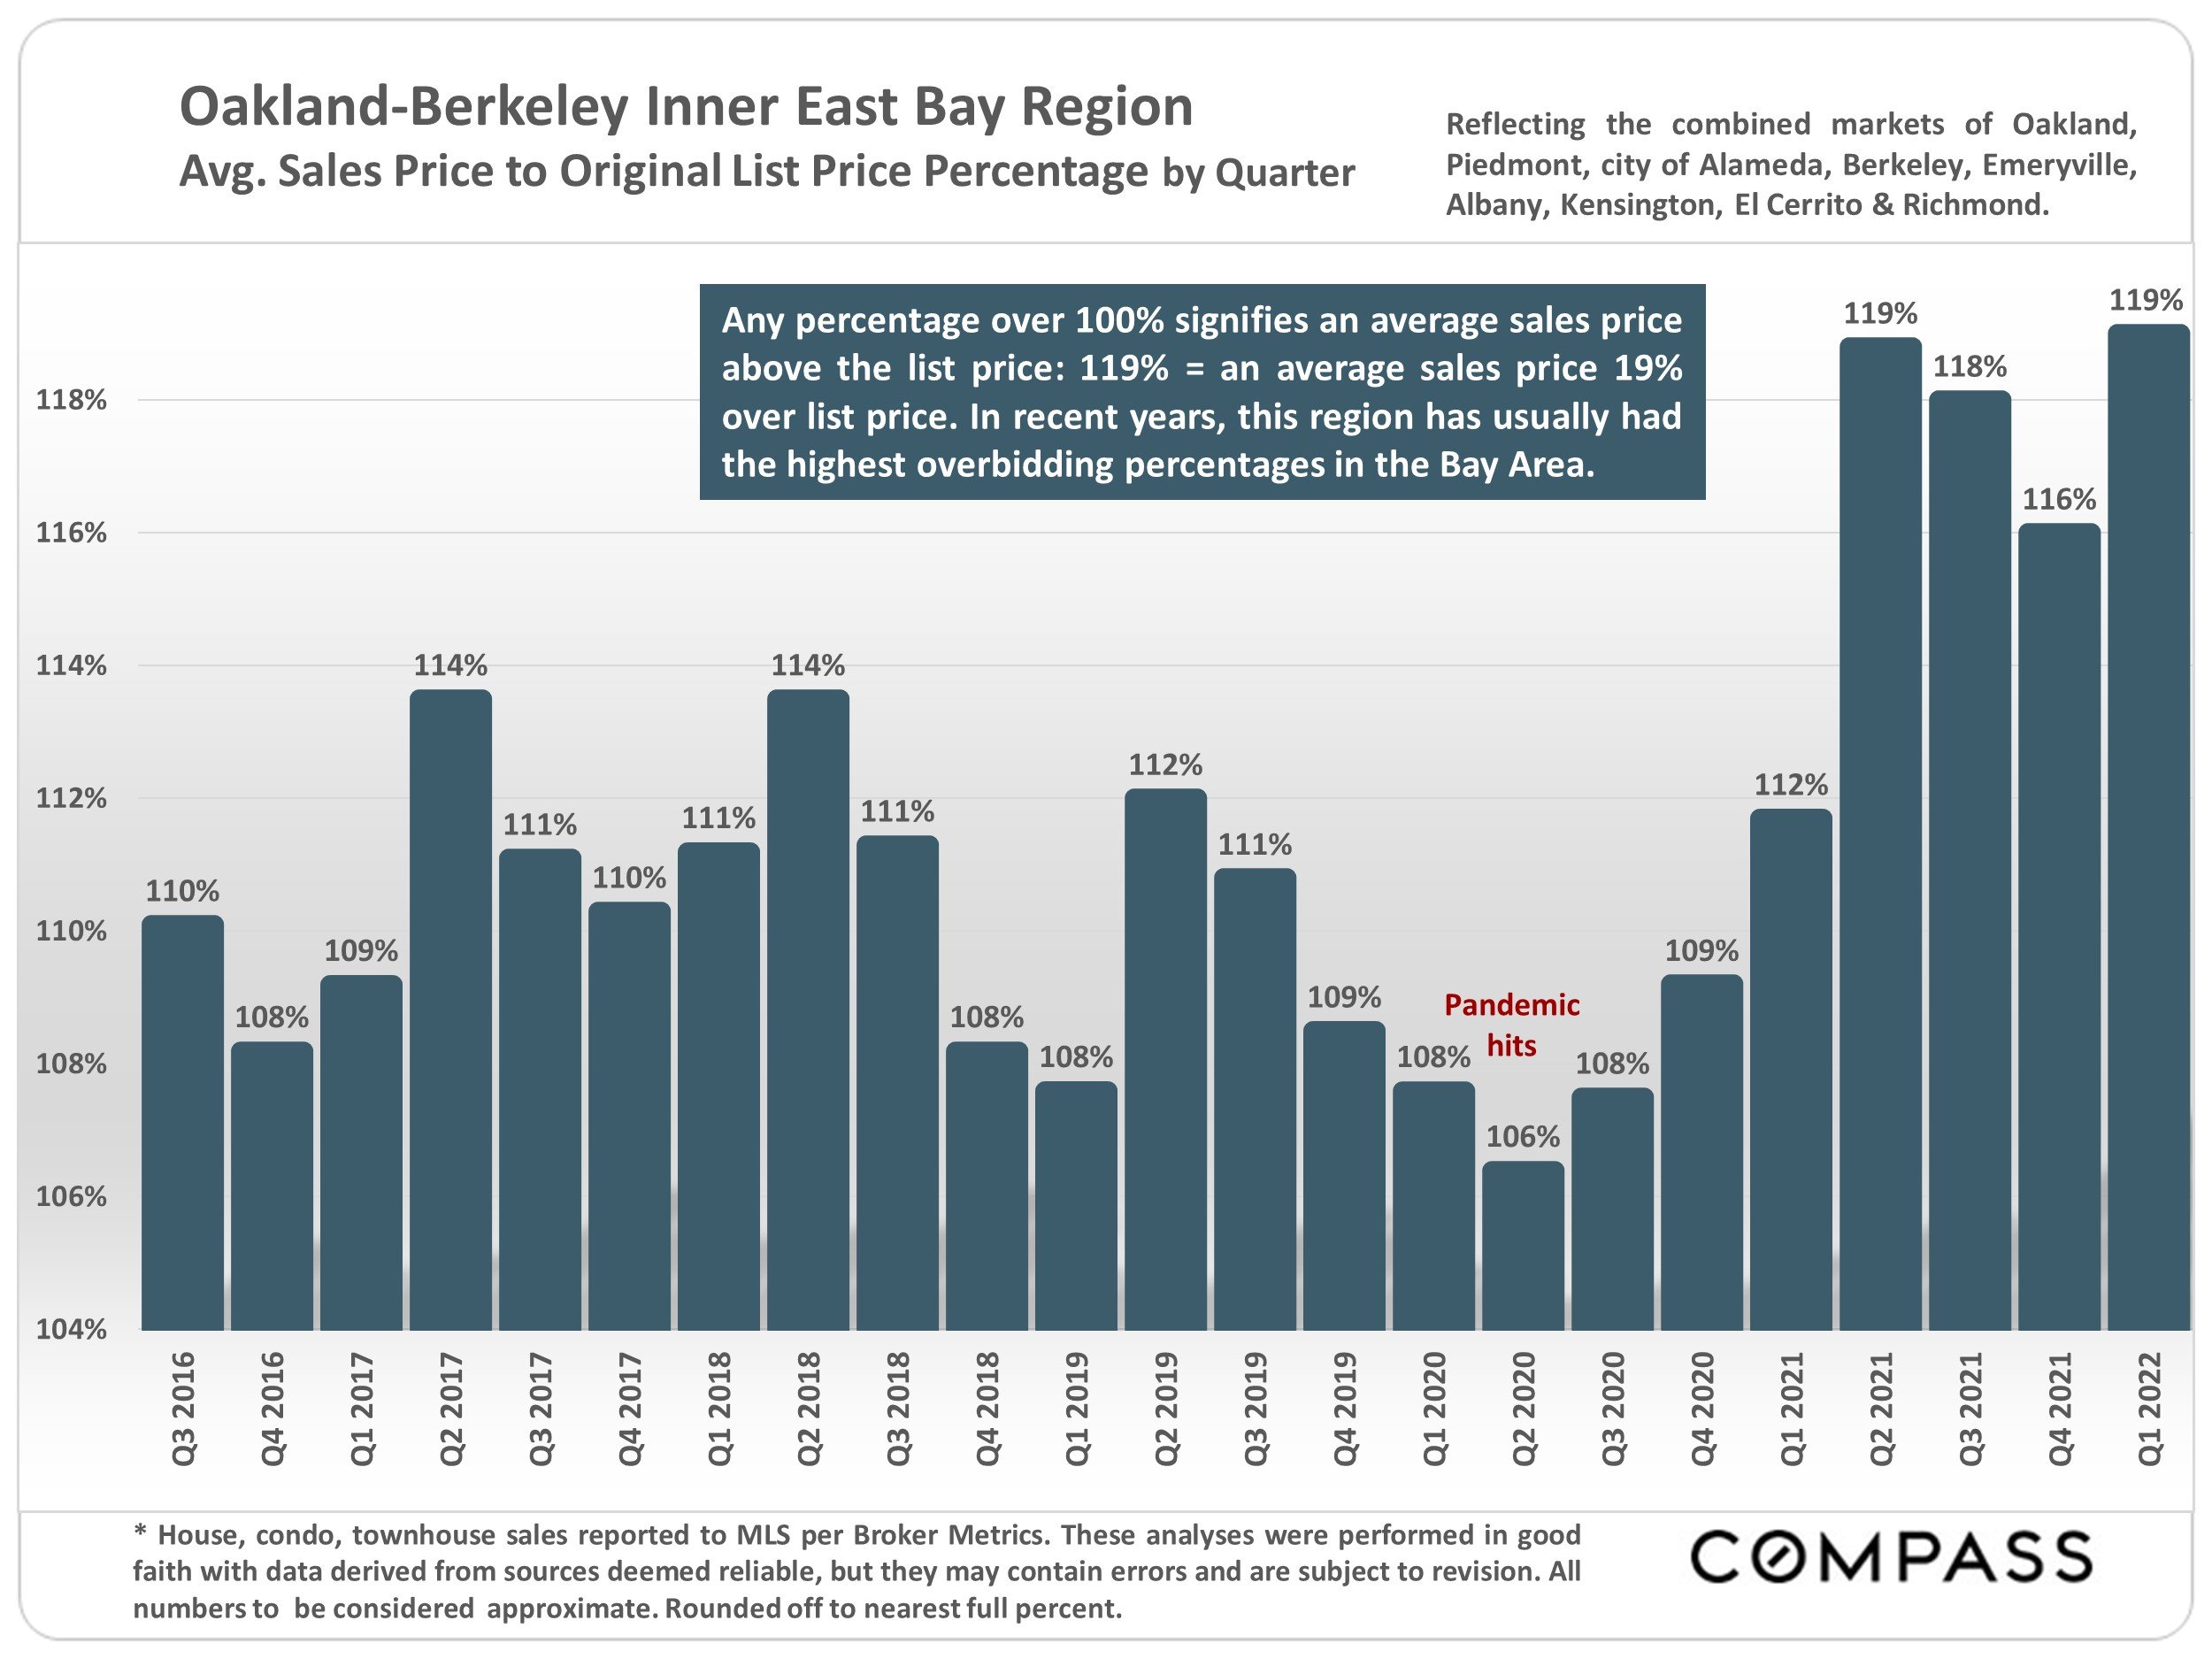
In recent years, the Inner East Bay Region has usually had the highest overbidding percentages in the Bay Area. The last year has seen the average sales price to original list price hover between 112%-119% over list. This overbidding is reflective of the hot market combined with tight inventory, creating a sellers market.