2021 In Review
Let’s wave a loving goodbye to 2021 and look forward to a year of promise ahead.
It was such a pleasure to work with wonderful clients and help with the following seller and buyer transitions!
Buyers are waking up and sellers; it's good to start planning as contractors and stagers are booking up!
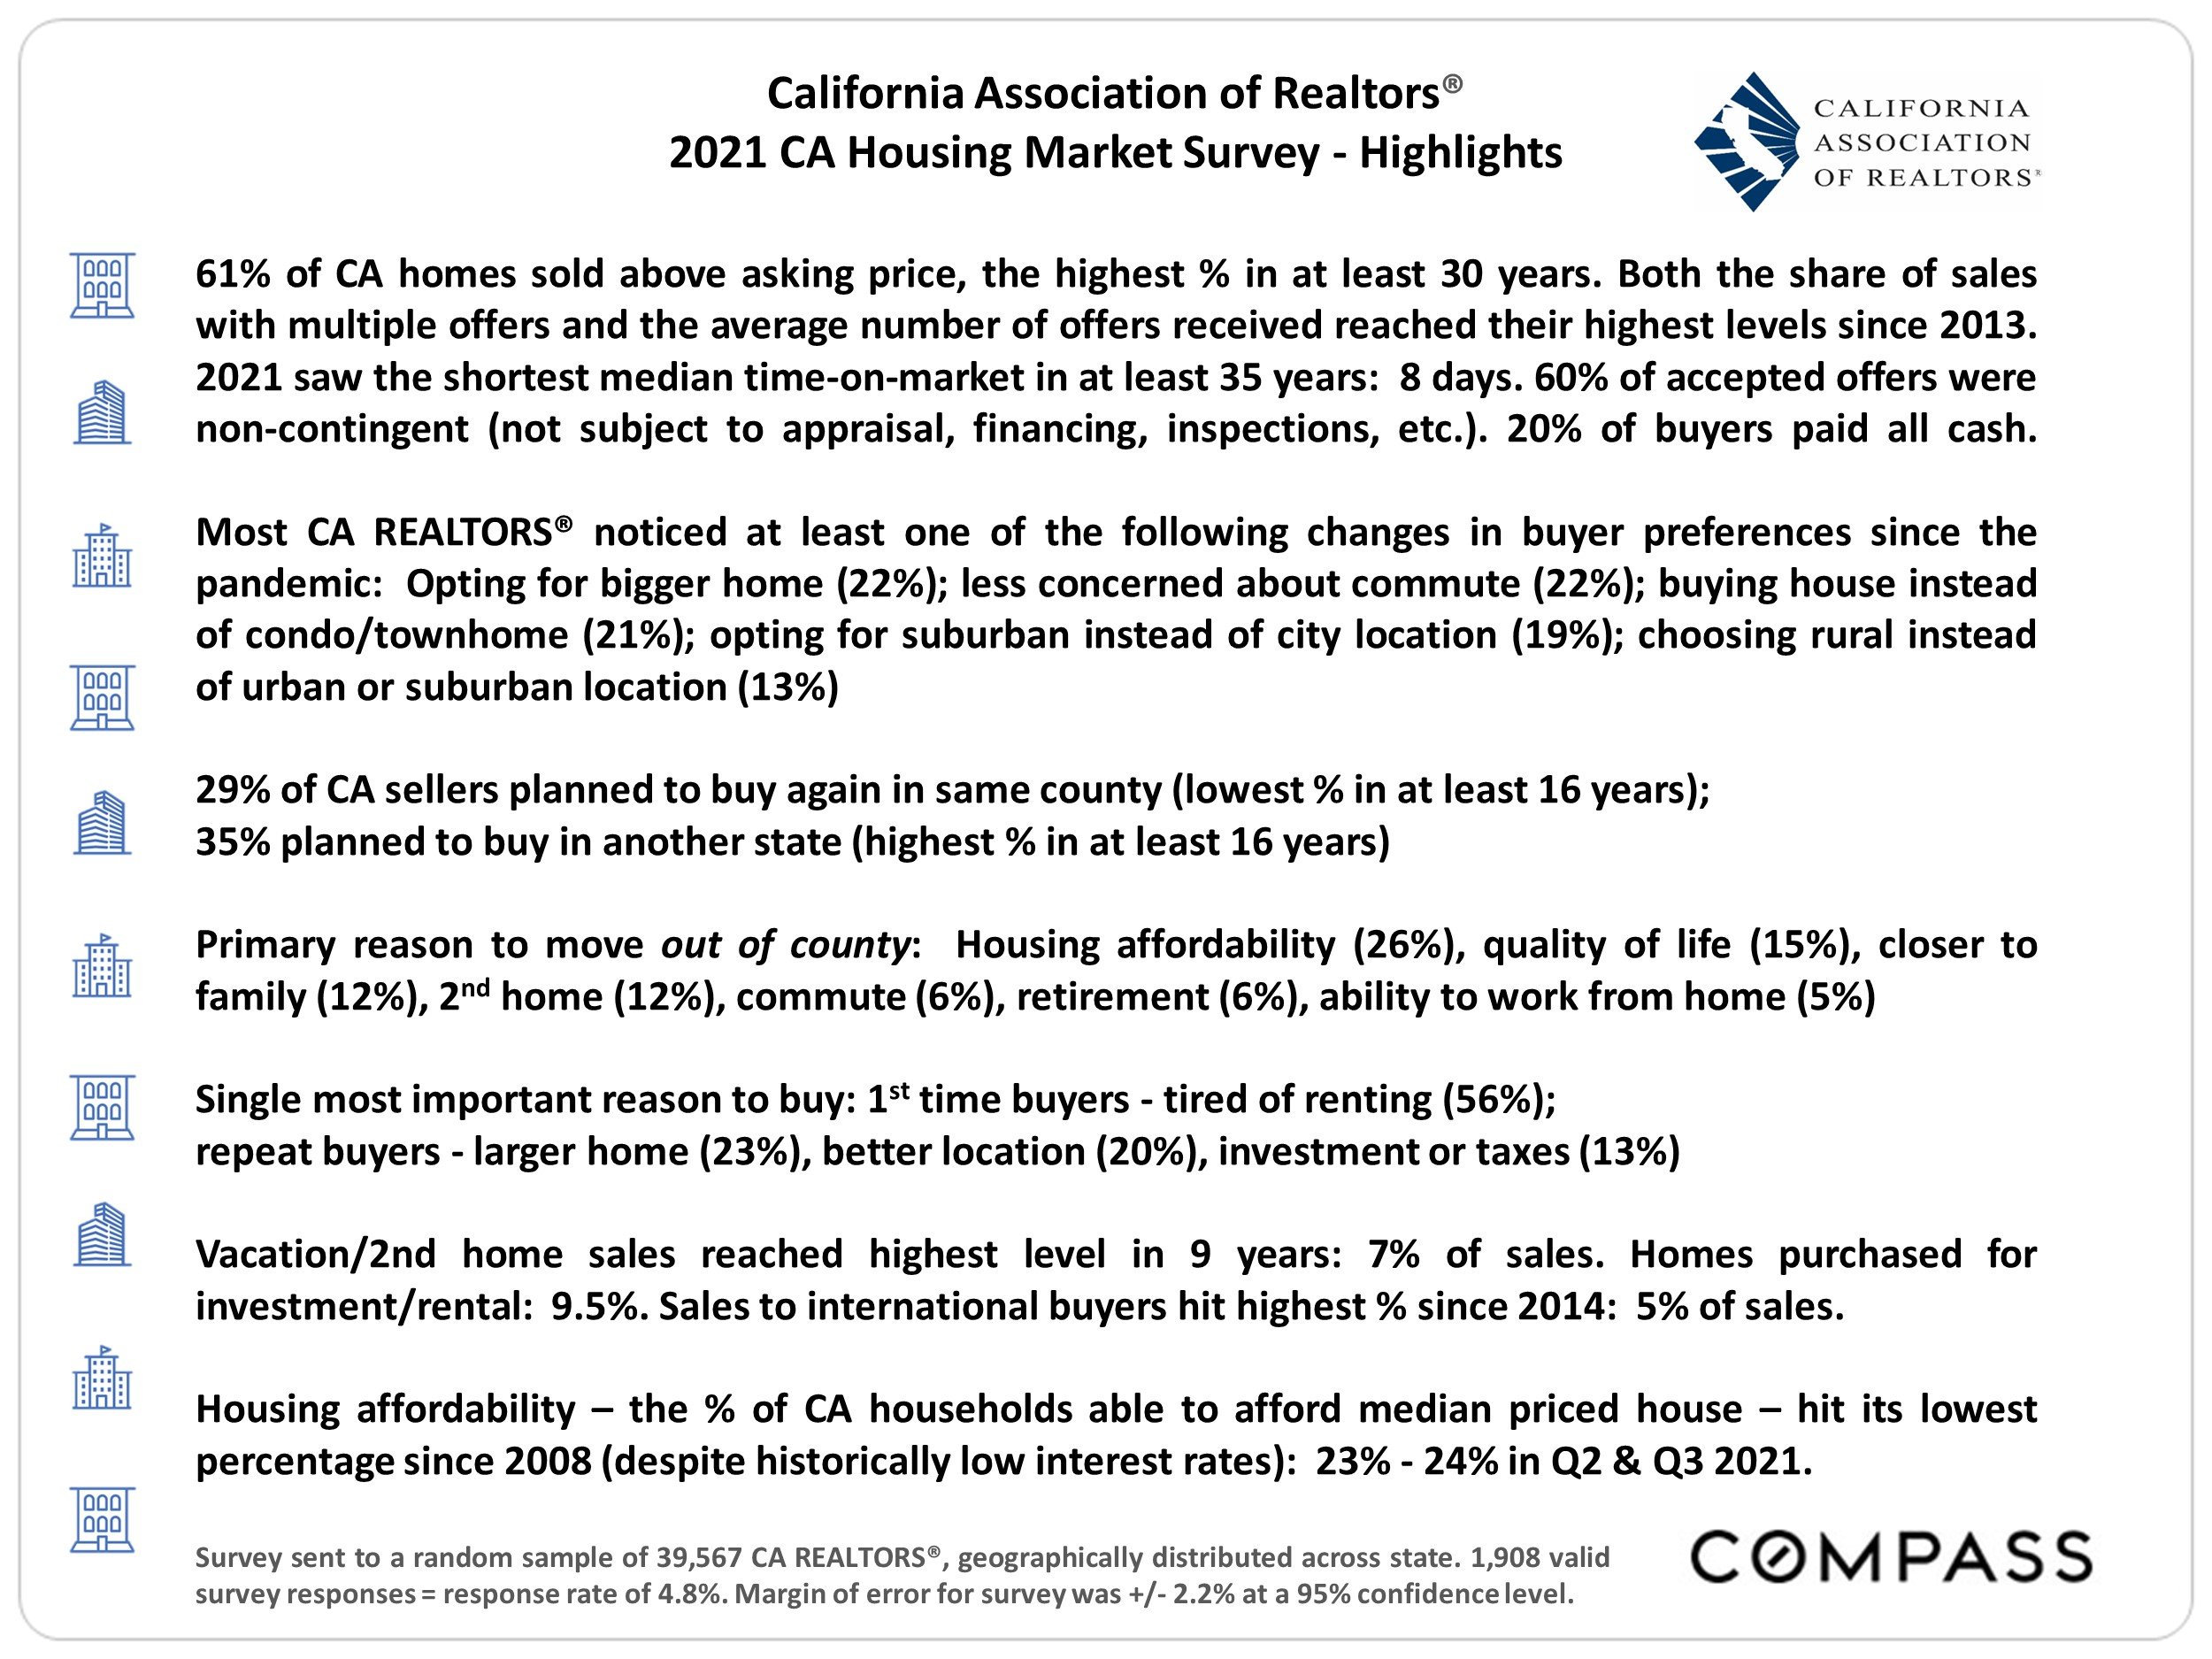
A few end of 2021 charts below. If you only read one check out the statewide data at the end!
Year Over Year Data points
The chart below shows quarterly median house prices. It looks like prices are dropping but the tall bar is the early Spring market which if you go back a few years this is regularly the strongest market for sellers.
2022 is off to a competitive start for buyers with ultra low single family home inventory.
Below is condo data. Relative to house prices, condos just have not gone up as much, they may be a good buy! Will this change when we emerge from COVID?
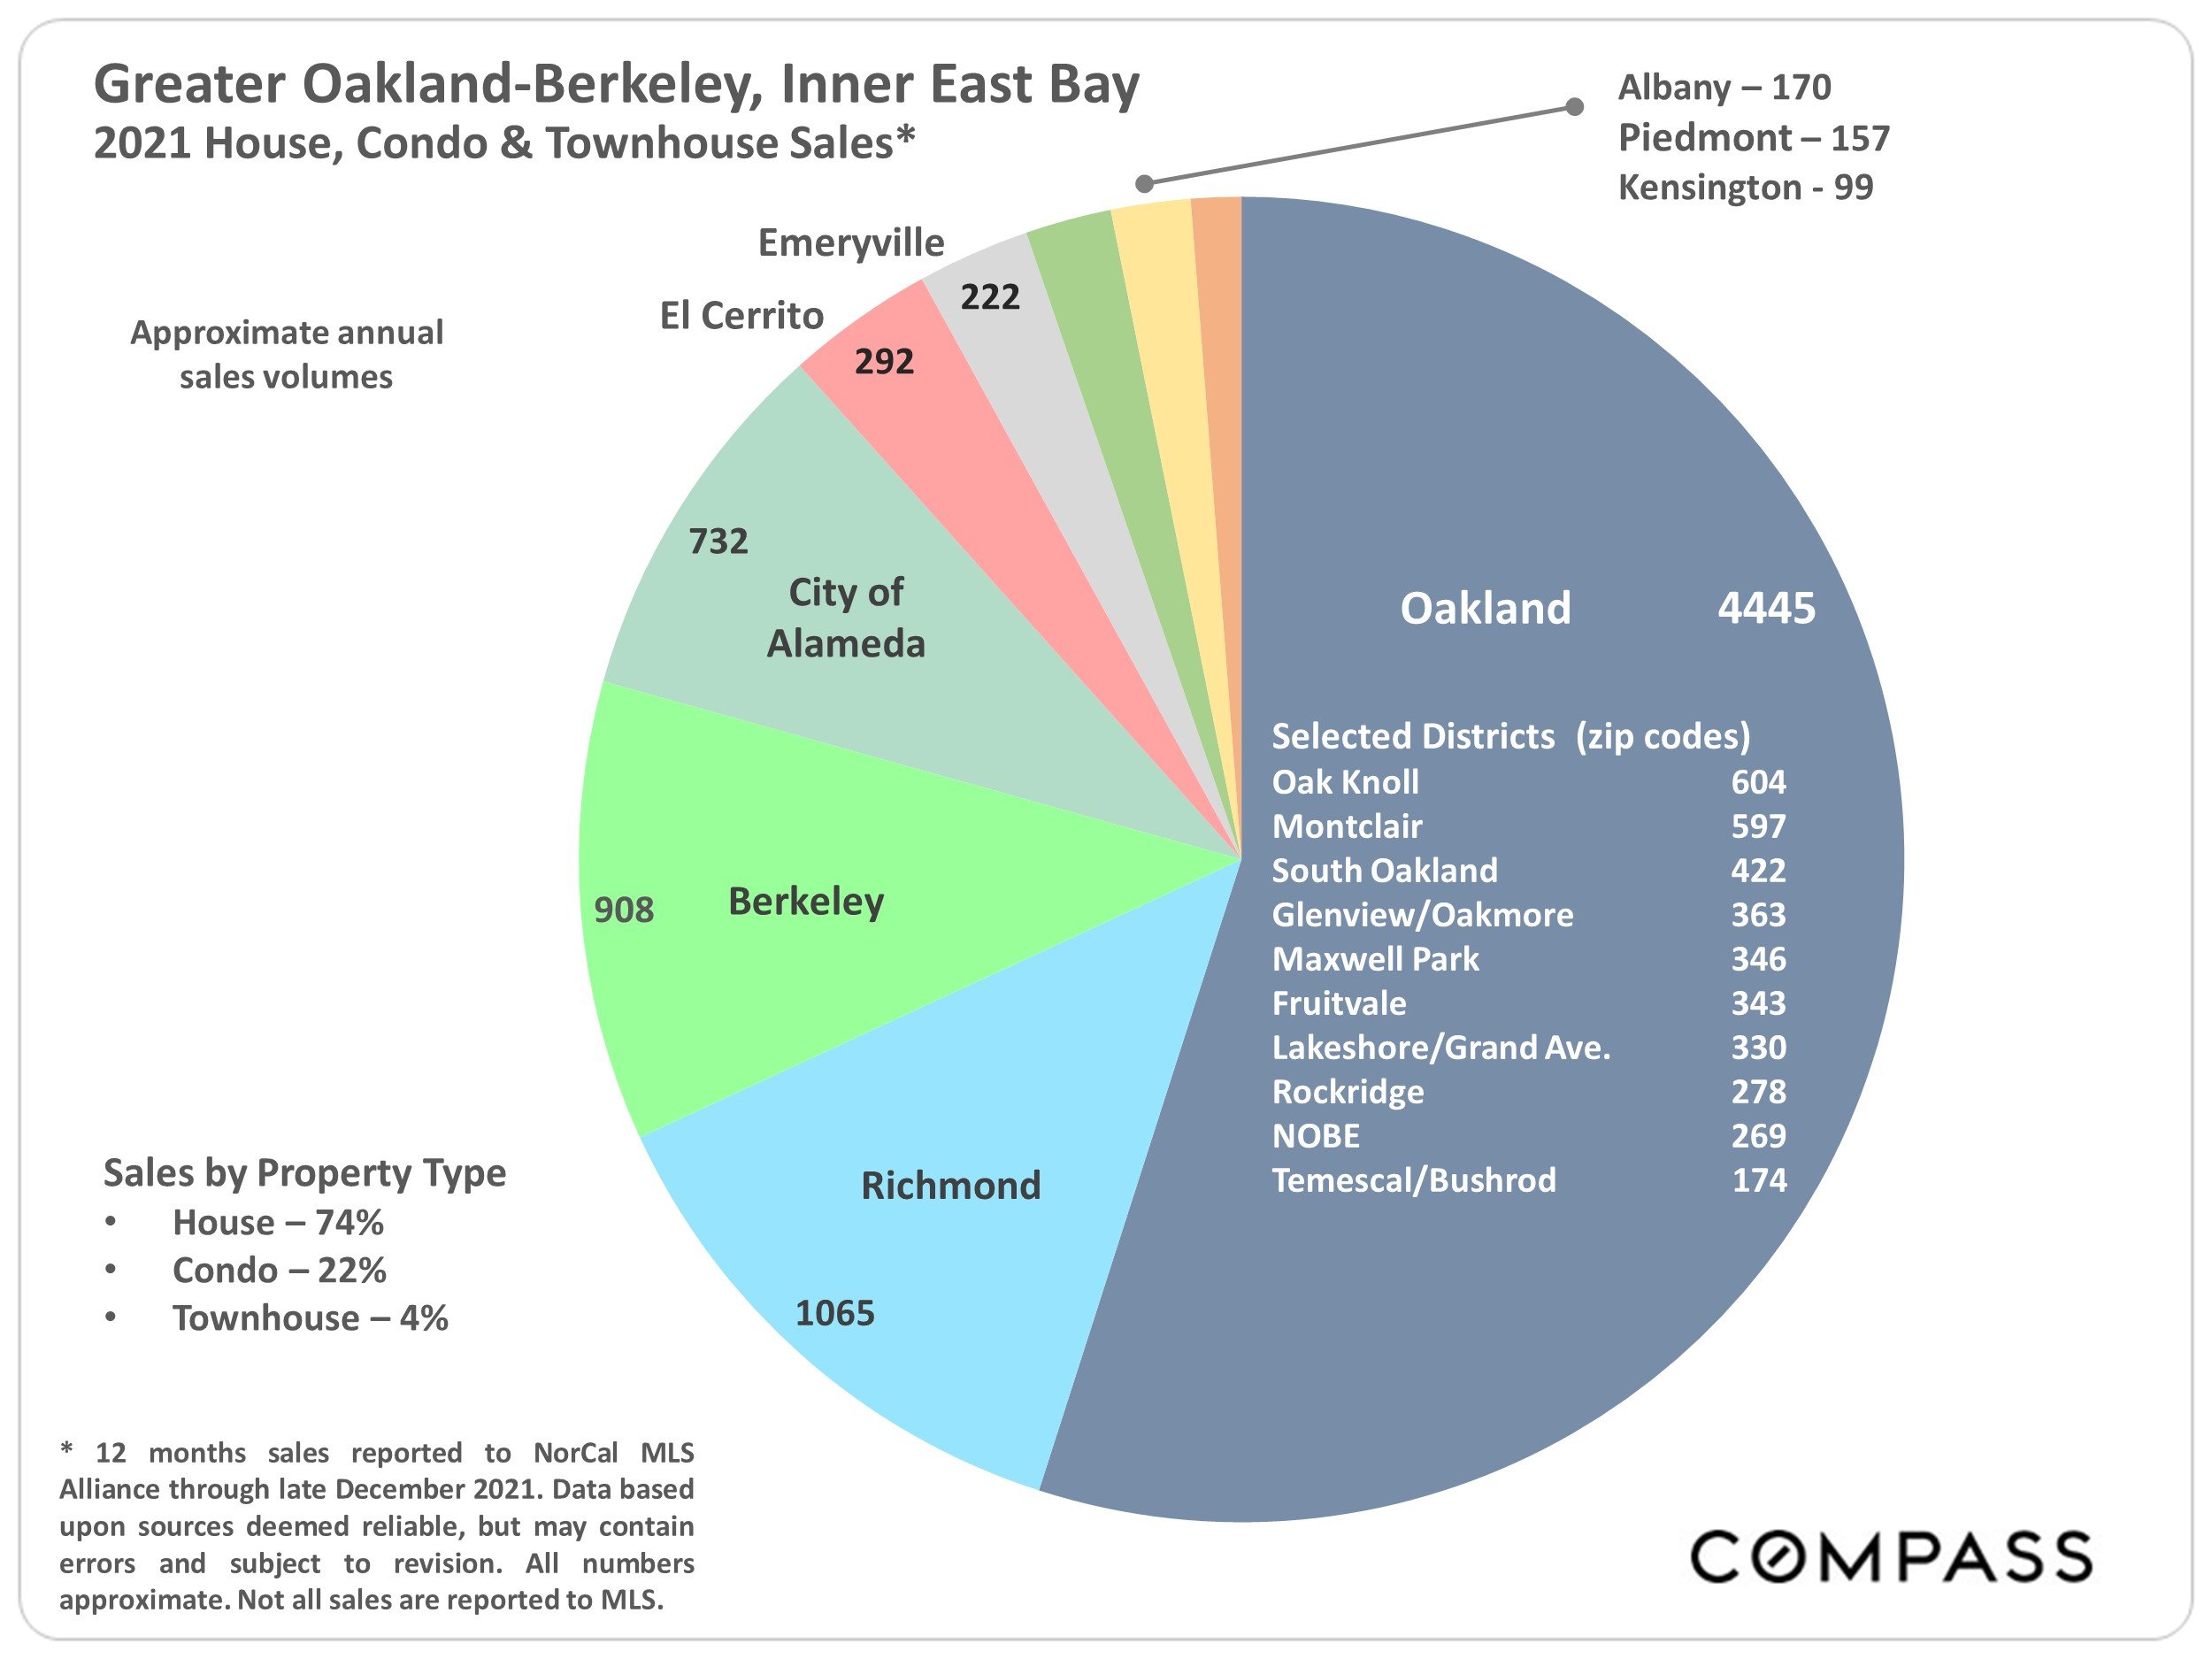
Oakland is a big city — fewer home choices in Kensington, Piedmont and Albany!
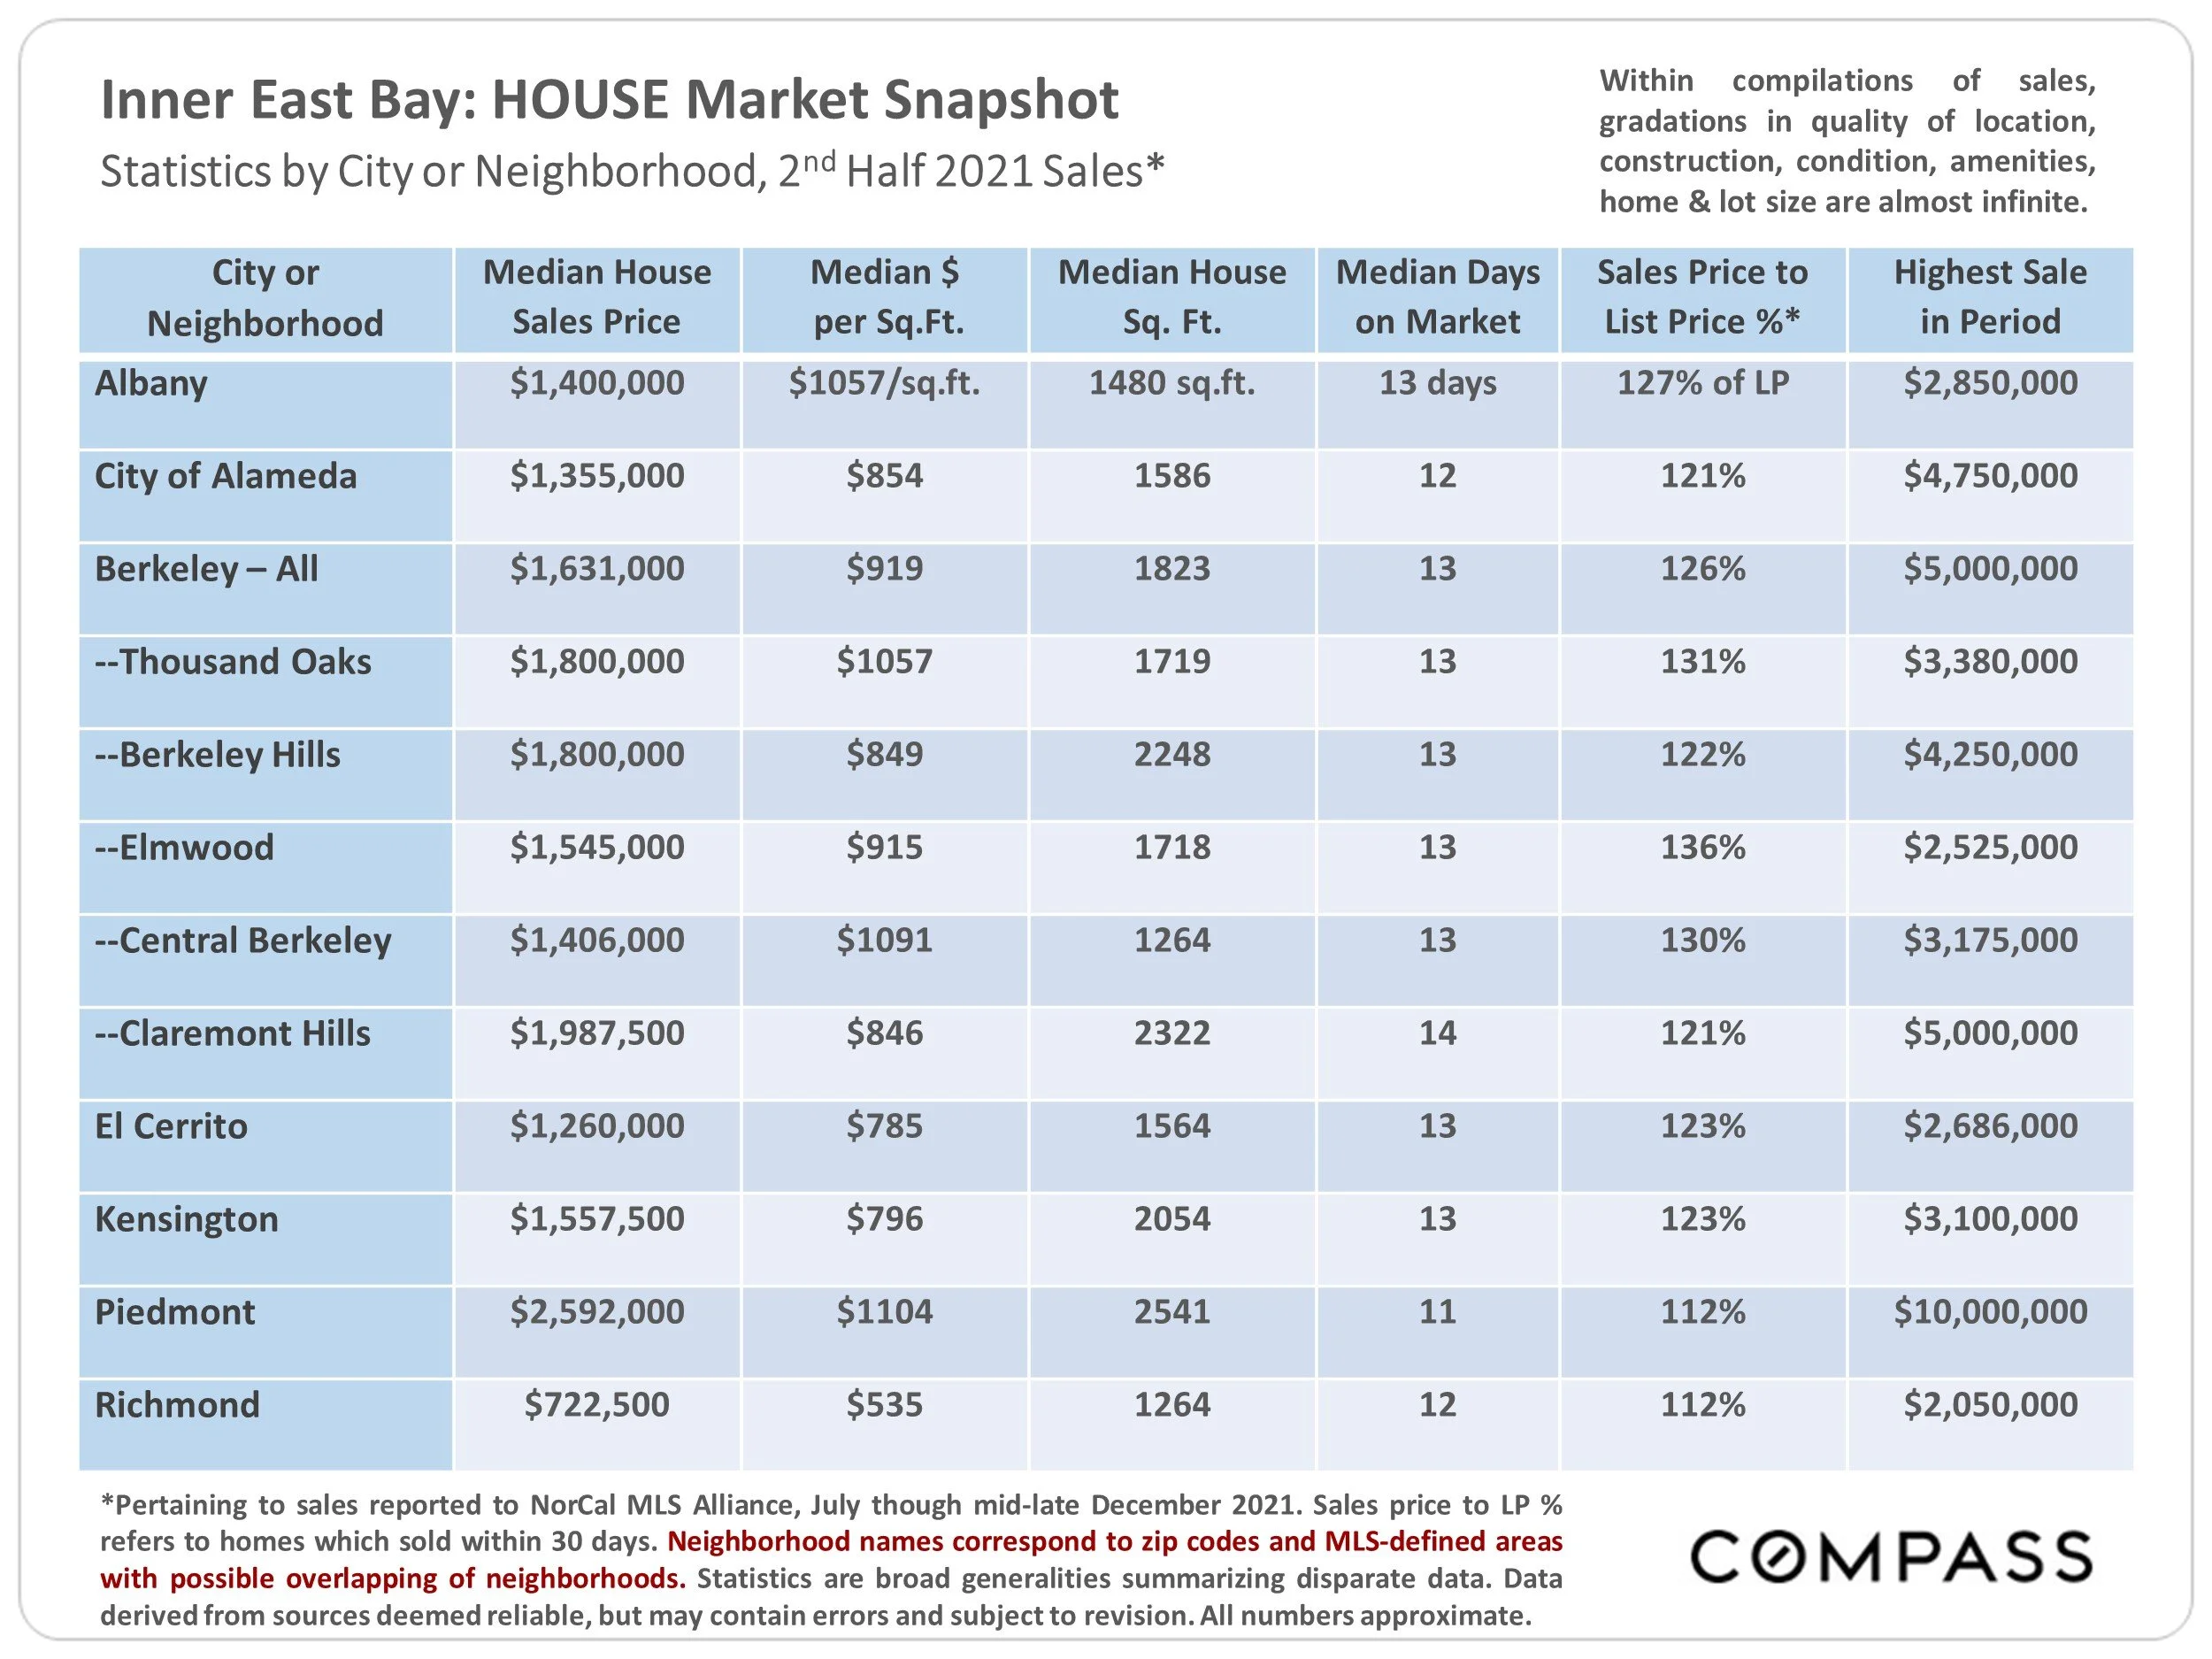
Blow are median house prices for the 2nd half of the year for all local cities except Oakland
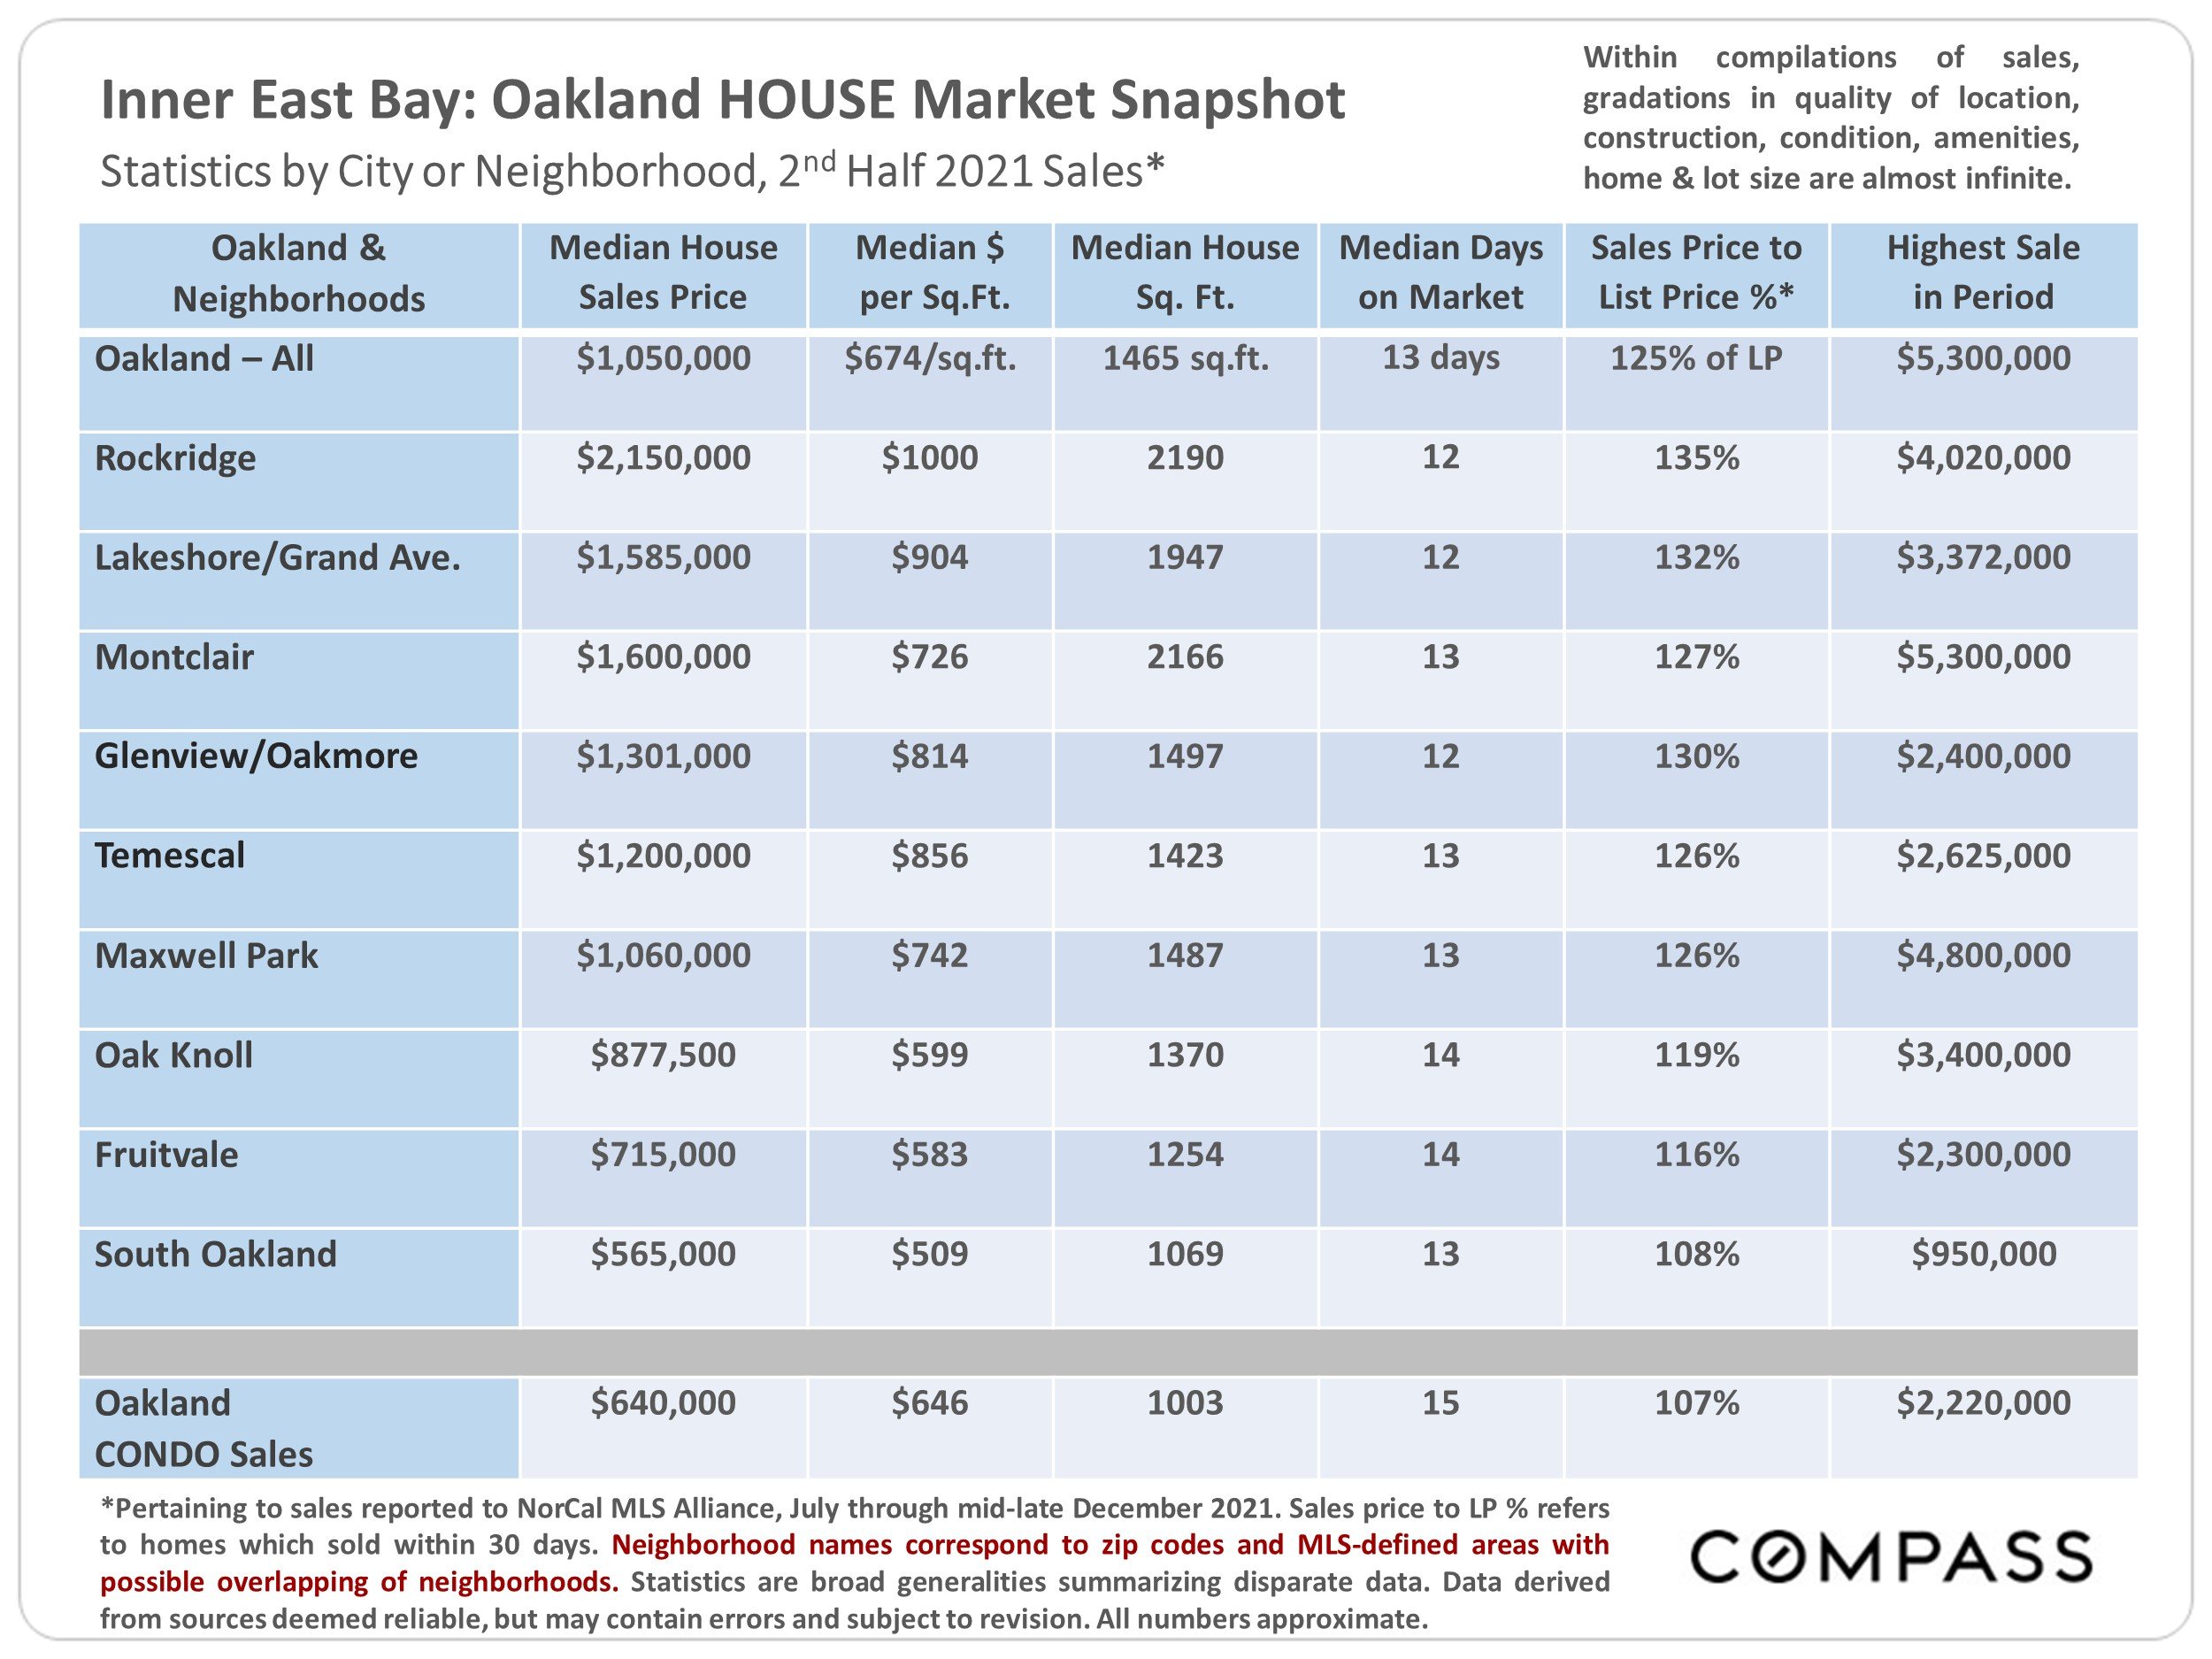
Median house price below for the 2nd half of the year for all Oakland and some neighborhoods broken out as well as overall condo sale data
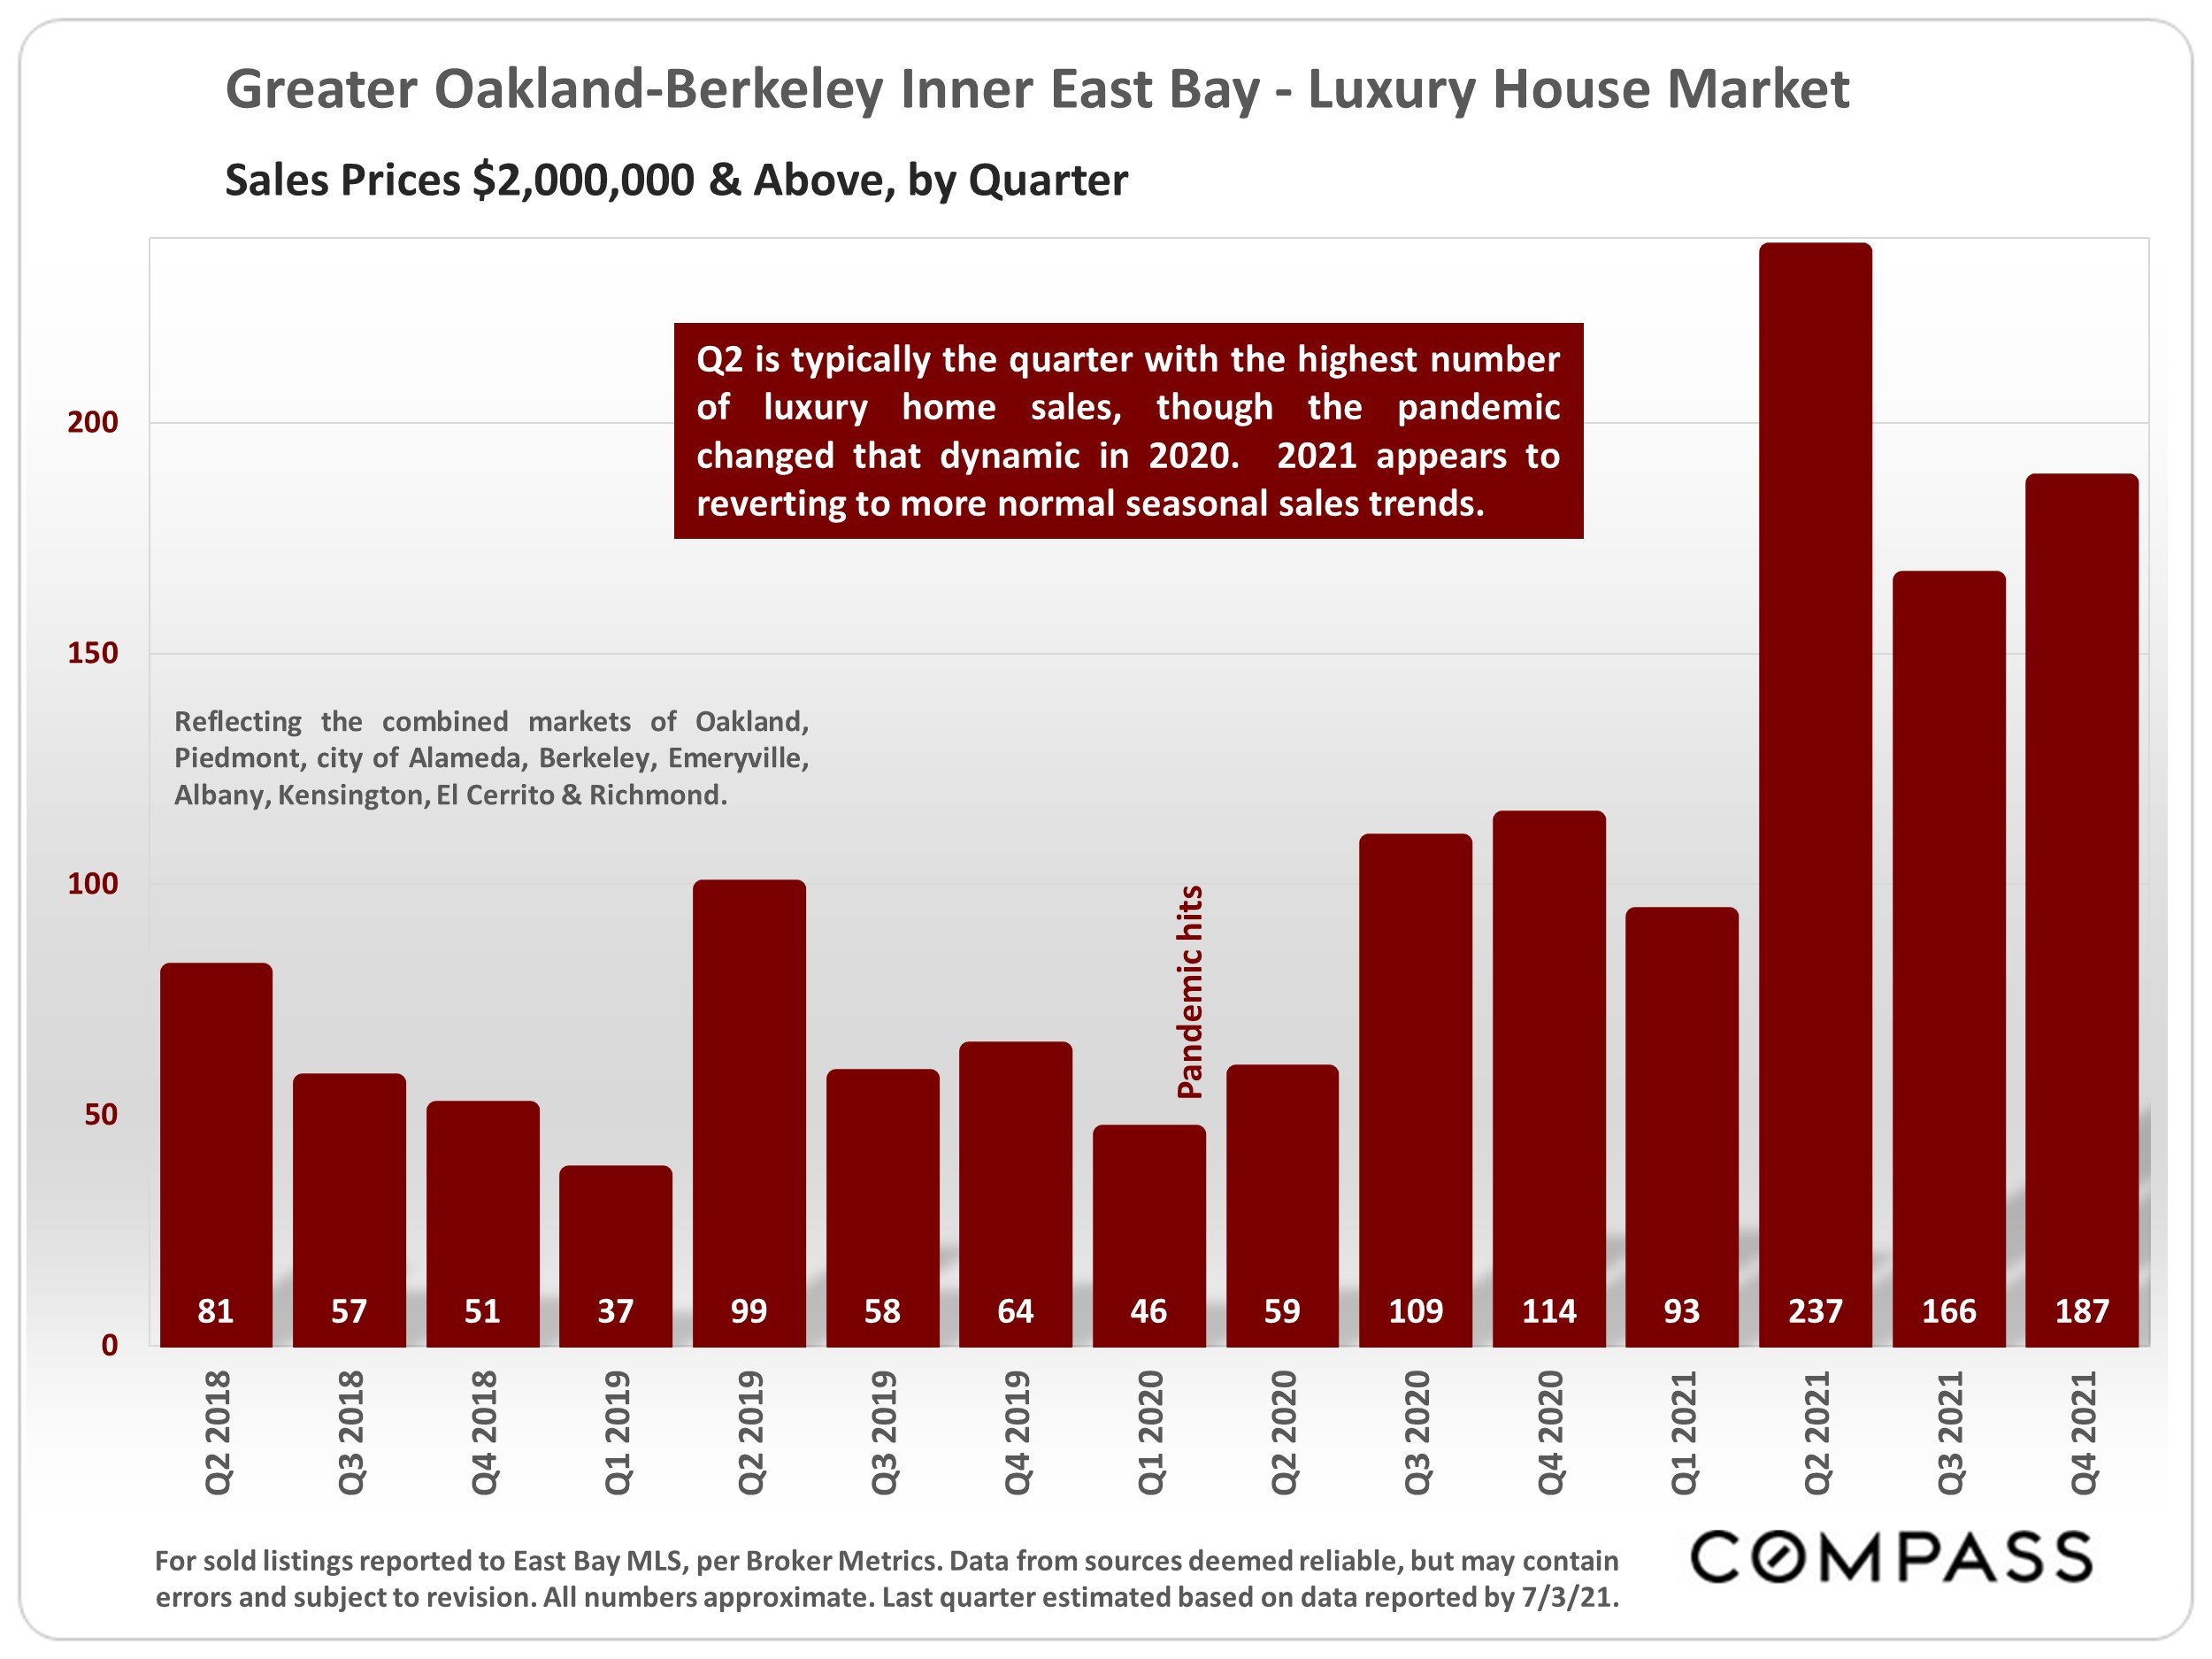
Below is sales volume for properties valued at over $2M. As a rule the April-June period sees the most sales in this category.
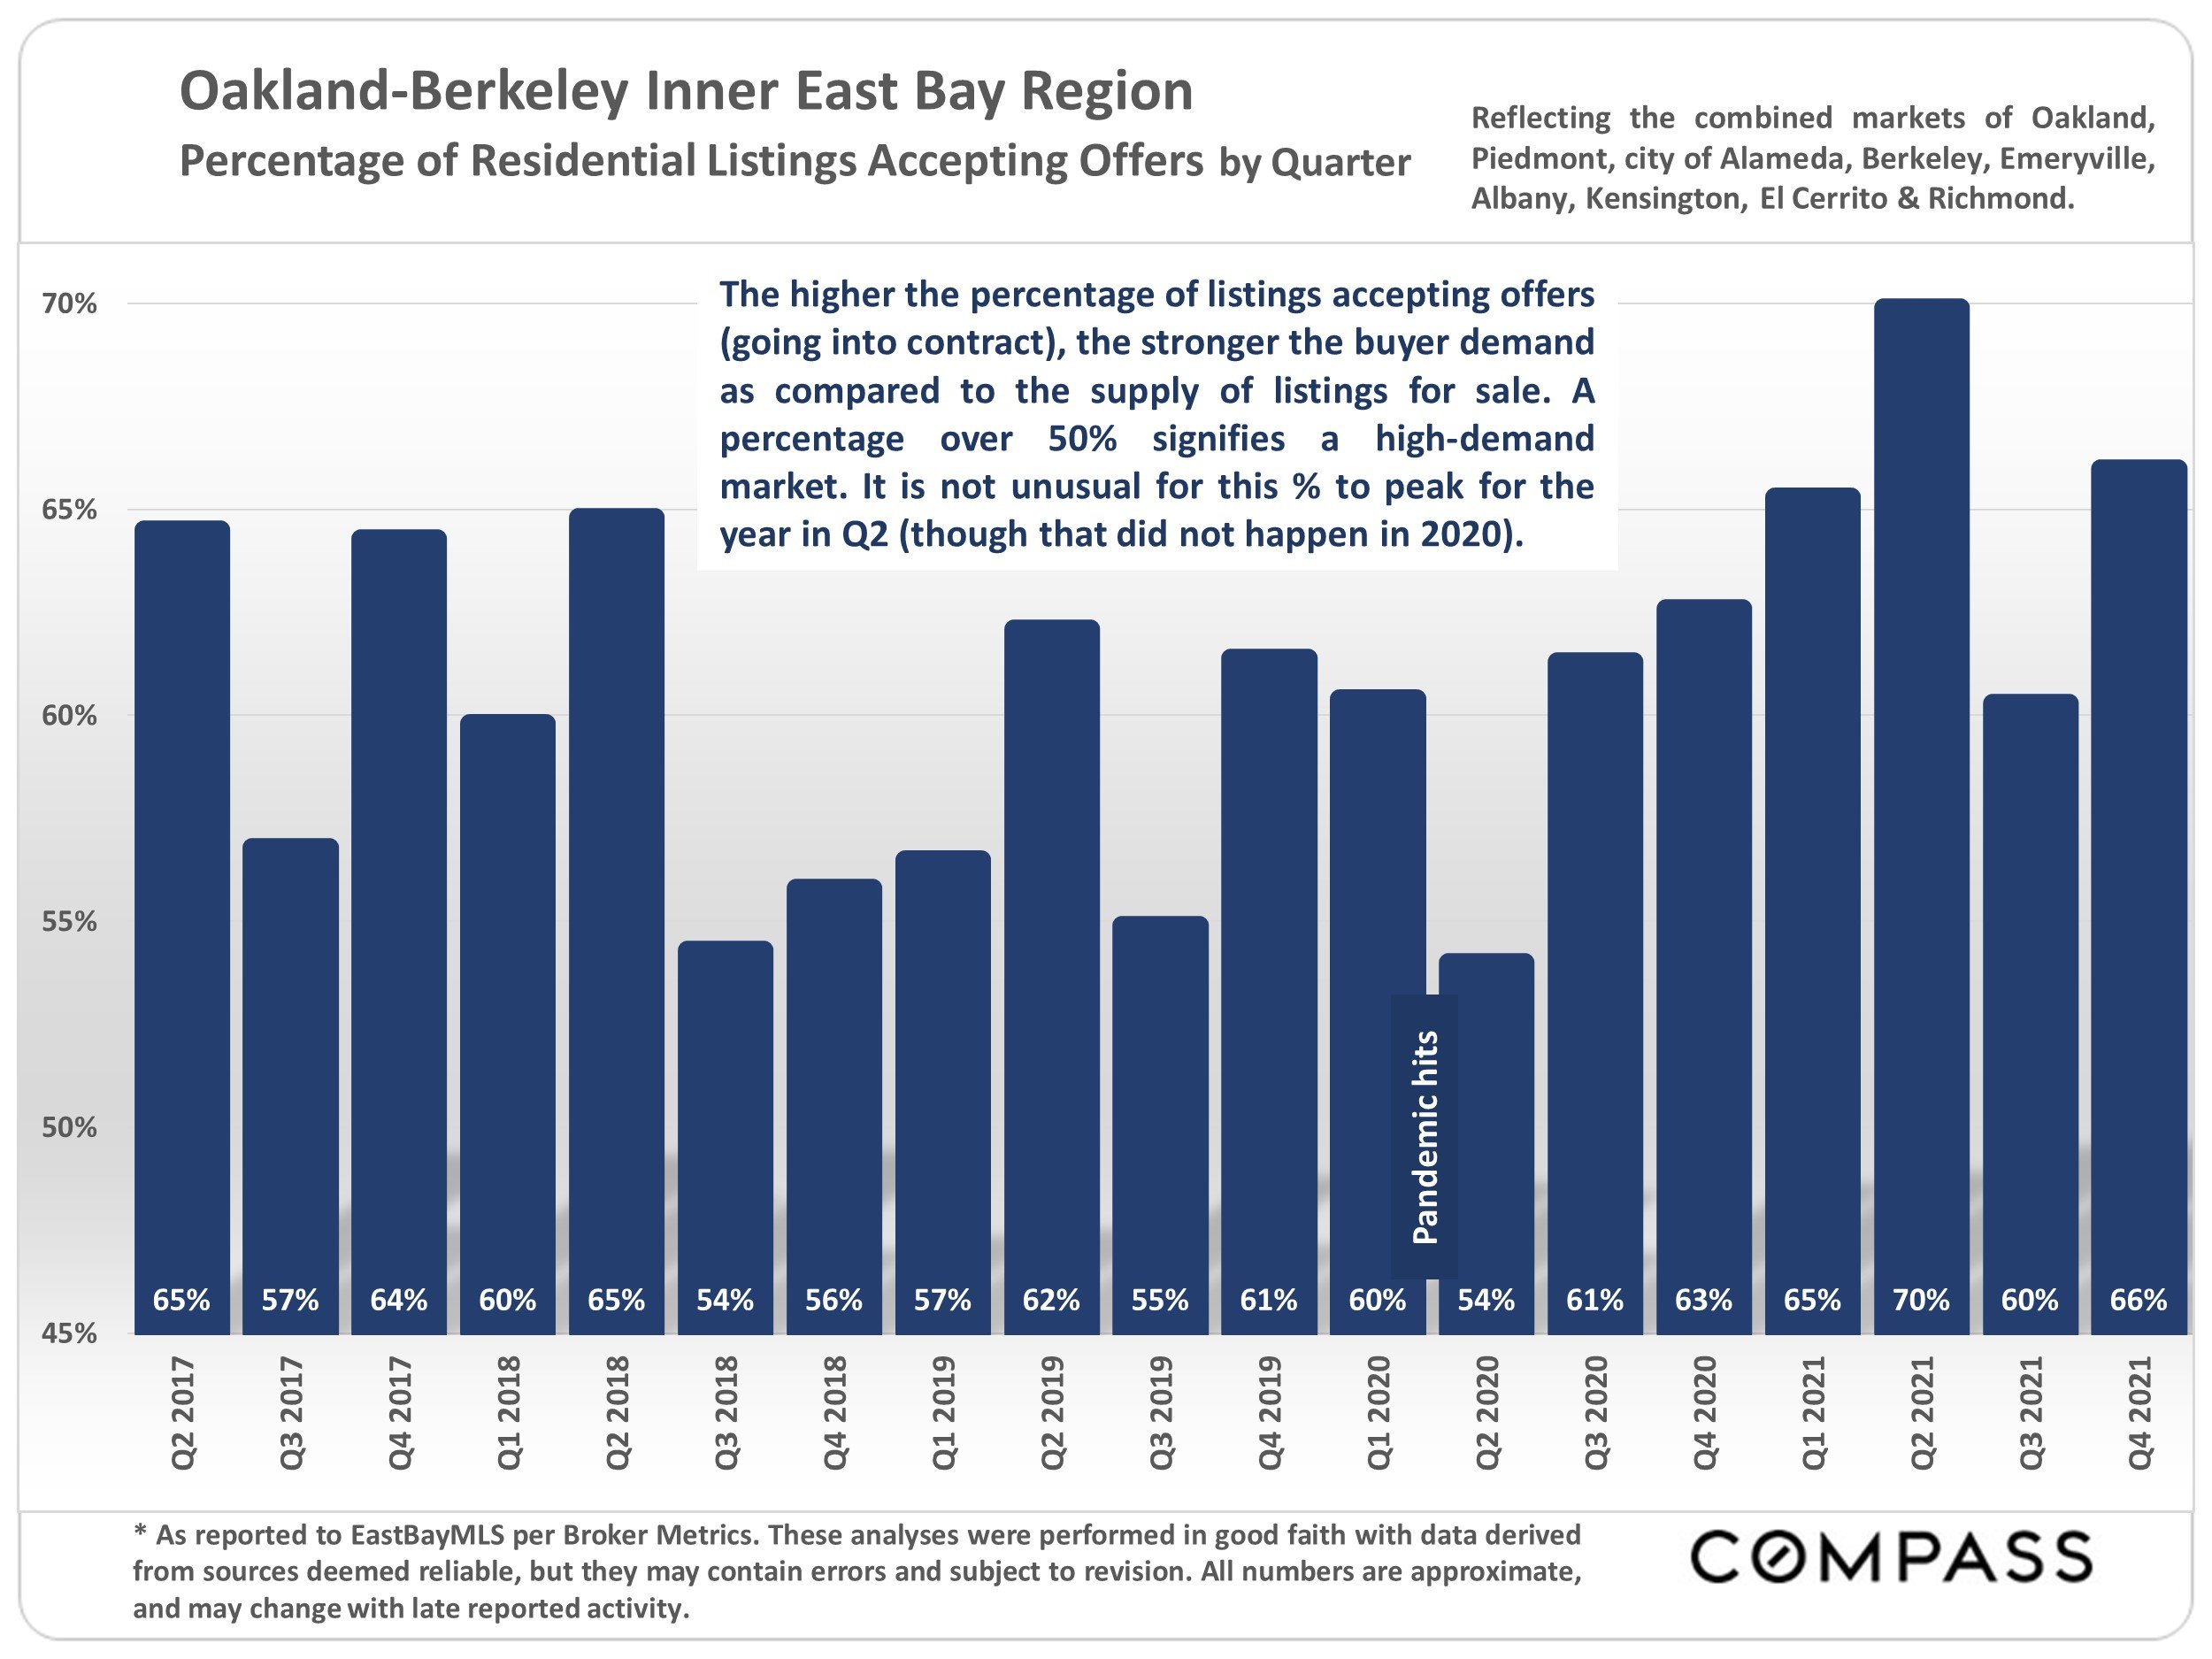
The taller the bar, the stronger the seller market. The end of 2021 was still pretty rough for buyers.
And if you are wondering about cash buyers — over 30% of our sales are cash.
Statewide data below —
I look forward to helping sellers and buyers navigate our local real estate market in 2022!


